.png)
What Is Return On Ad Spend A Complete Guide For Marketers
- Jason Wojo
- Dec 12, 2025
- 16 min read

If you’re spending money on ads, there’s one question that matters more than any other: “Is this actually working?”
Clicks, impressions, and likes are nice, but they don't pay the bills. You need to know if the money you're pouring into advertising is bringing more money back out. That’s where Return on Ad Spend (ROAS) comes in.
Your Ad Campaigns’ Profitability Report Card
ROAS is the North Star metric for any ad campaign. It cuts through the noise and tells you exactly how much revenue you’re generating for every single dollar you spend. It’s the ultimate gut check.
Think of it like a vending machine. You put $1 in (your ad spend) and get a $4 snack back (your revenue). That’s a 4:1 ROAS. It’s a direct, unfiltered look at how efficiently your advertising is making you money.
While other metrics might tell you if people are seeing your ads, ROAS tells you if those ads are actually driving sales. It’s the difference between popularity and profitability.
The Core Formula Explained
Getting your head around ROAS starts with its beautifully simple formula. This is the foundation for every analysis, whether you're running a small Facebook ad test or managing a massive Google Ads budget.
Return on Ad Spend (ROAS) = Total Campaign Revenue / Total Ad Spend
The result is usually expressed as a ratio (like 5:1) or a multiplier (5x). Both mean the same thing: for every $1 you spent, you earned $5 back in revenue. This clarity is everything. It helps you decide where to double down and where to pull back.
A high ROAS is a green light—a sign of a healthy, profitable campaign. A low ROAS? That’s your signal that something needs fixing, and fast.
To break it down even further, let's look at the two simple inputs that make up the calculation.
Key Components Of The ROAS Formula
This table breaks down the two essential parts of the Return on Ad Spend calculation to ensure a clear understanding.
Component | Description | Example |
|---|---|---|
Total Campaign Revenue | The total value of sales directly generated by your ad campaign within a specific timeframe. | $10,000 in sales from your Black Friday campaign. |
Total Ad Spend | The total amount of money you spent on the ad campaign, including platform fees and creative costs. | $2,500 spent on Google and Facebook ads. |
Using the examples in the table, the ROAS would be $10,000 / $2,500 = 4x, or a 4:1 return. Pretty straightforward, right?
This kind of direct financial feedback is invaluable. For a deeper dive, it's also worth understanding the broader concept of Video Marketing ROI, which applies similar principles specifically to the impact of your video content.
Ultimately, ROAS isn’t just a number to report—it’s a strategic tool.
Identifies Winners: It instantly flags which campaigns, ad groups, or specific creatives are carrying the team.
Justifies Your Budget: Nothing gets a marketing budget approved faster than showing cold, hard proof that your ads are generating real revenue.
Guides Optimization: When ROAS is low, you know exactly where to start digging. Is it the targeting? The ad copy? The landing page? It points you in the right direction.
How To Calculate ROAS In The Real World
Knowing the ROAS formula is one thing, but applying it to the messy, day-to-day reality of running ad campaigns is a whole different ball game. Let’s get our hands dirty and walk through how this actually works for different kinds of businesses.
The core idea is always the same: you’re just comparing the money your ads bring in to what you spent to run them. The only thing that changes is how you define and track that revenue.
The E-commerce Calculation
For any online store, figuring out ROAS is usually pretty straightforward. Revenue is clear, direct, and your ad platforms and analytics tools are already set up to track it for you.
Let's say you run a store selling custom-printed t-shirts and decide to launch a Google Shopping campaign for a hot new design.
Total Ad Spend: You put $1,000 into the campaign over one month.
Total Campaign Revenue: In that same month, Google Analytics shows the campaign drove $5,000 in direct sales.
Now, we just plug those numbers into the formula:
ROAS = $5,000 (Revenue) / $1,000 (Ad Spend)
Your ROAS is 5x, or a 5:1 ratio. Simple. For every single dollar you spent on that Google Shopping campaign, you got five bucks back in t-shirt sales. That’s a clear signal the campaign is a winner and probably a good place to push more budget.
The Lead Generation Calculation
But what about when your ads don’t lead to an immediate sale? This is the reality for most service-based businesses—a local med spa, a real estate agency, or a B2B software company. Here, the goal isn't an instant purchase; it’s getting a qualified lead.
Calculating ROAS in this world requires one extra, crucial step: figuring out what a lead is actually worth in dollars.
Let's imagine you're a mortgage broker running Facebook ads to get leads for home refinancing.
To nail down ROAS for lead generation, you first have to determine the average value of a lead. This is how you connect your marketing spend to real business results, even if the sale happens offline weeks or months later.
First, you need to look at your own business numbers:
Average Lifetime Value (LTV) of a Client: You’ve crunched the numbers and know that, on average, a new client is worth about $4,000 to your brokerage over their lifetime.
Lead-to-Client Conversion Rate: Looking at your sales data, you see that 1 out of every 10 qualified leads actually signs on the dotted line and becomes a paying client. That’s a 10% conversion rate.
With these two numbers, you can calculate the value of a single lead:
Lead Value = Average Client LTV x Lead-to-Client Conversion Rate Lead Value = $4,000 x 10% = $400
Boom. Every qualified lead your campaign generates is worth an estimated $400 in potential revenue. Now we can figure out your ROAS. Let’s say your campaign stats are:
Total Ad Spend: You spent $2,000 on your Facebook ads.
Total Leads Generated: The campaign brought in 20 qualified leads.
First, calculate the total potential revenue from those leads: Total Revenue Value = 20 Leads x $400/Lead = $8,000
Finally, let's get that ROAS: ROAS = $8,000 (Revenue Value) / $2,000 (Ad Spend) = 4x
Your campaign hit a 4:1 ROAS. Even without a "Buy Now" button, you’ve proven that your advertising is generating a solid return by creating valuable opportunities for your sales team. This method is a game-changer for any business that relies on leads, quotes, or consultations to measure what’s working.
What A Good ROAS Looks Like Across Industries
It's the question every marketer asks: "Is my ROAS any good?"
The honest answer? It depends. There's no magic number that works for everyone. A "good" Return on Ad Spend is a moving target that hinges on your industry, your profit margins, and the overall health of your business. Chasing some universal benchmark is a mistake.
A 3:1 ROAS might be a disaster for a low-margin ecommerce store, but it could be a home run for a high-margin software company. The real goal isn't hitting an arbitrary number; it's about figuring out what's profitable and sustainable for your specific situation.
This simple visual breaks down the core relationship between the money you put in and the money you get out.
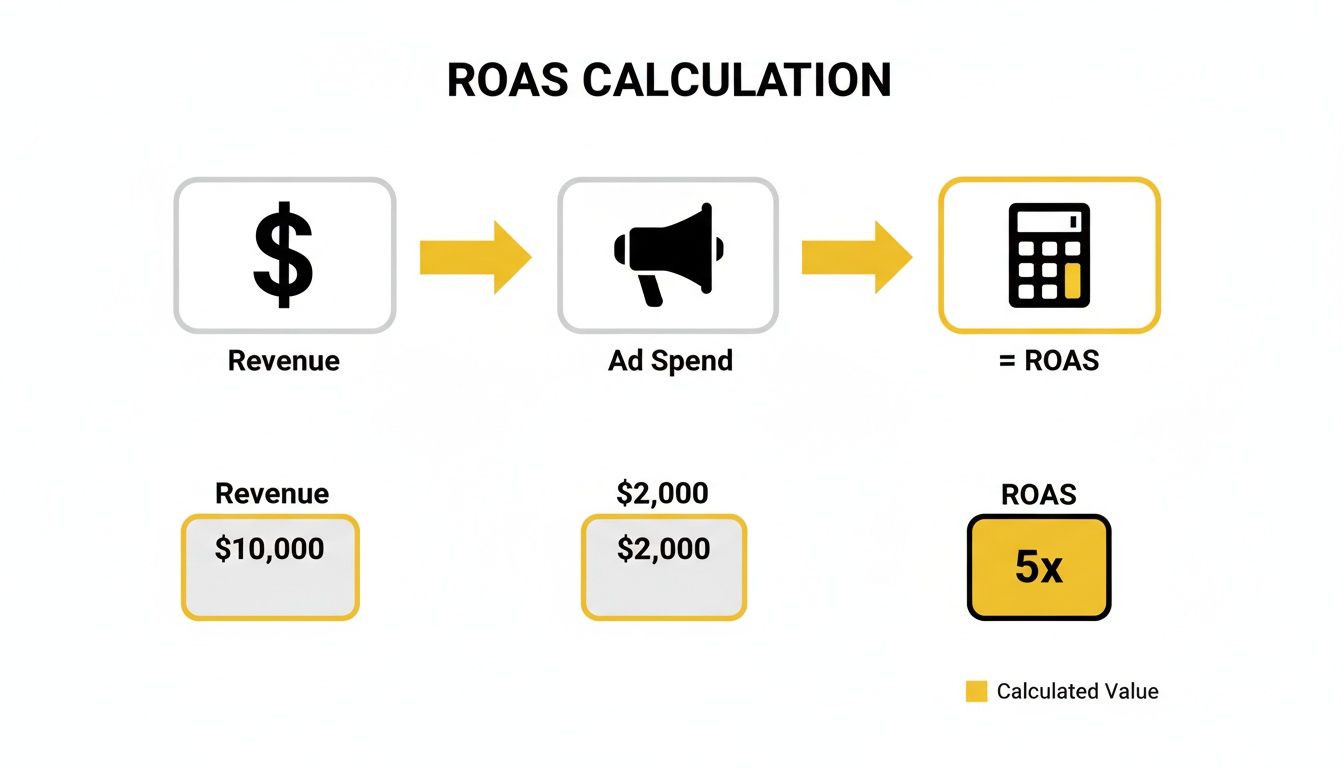
At its heart, that’s all ROAS is—a direct line from ad spend to revenue. Everything else is just context.
Why Industry Benchmarks Differ
Different industries play by completely different rules, and that directly impacts what they consider a good ROAS. A subscription service with a high Customer Lifetime Value (LTV) can afford a much lower return upfront because they know a customer will pay them back over and over again. On the other hand, a retailer selling cheap gadgets needs an immediate high return just to stay in the black.
A few key things cause these big swings:
Profit Margins: If your margins are paper-thin (think consumer electronics), you need a much higher ROAS just to break even. But if you’re selling something with fat margins, like a digital course, you can thrive on a lower ROAS.
Customer Lifetime Value (LTV): A SaaS company might be thrilled with a 1:1 ROAS on the first month's payment, especially if they know the average customer sticks around for two years. They’re playing the long game.
Sales Cycle Length: B2B companies often have sales cycles that last for months. Their ad campaigns are built to generate leads, not immediate sales, so they calculate ROAS based on the potential value of those leads.
Market Competition: Trying to advertise in a cutthroat space? Your ad costs are going to be higher, which naturally pushes down your ROAS, even if your campaigns are killing it.
Getting a handle on these dynamics is the first step to setting goals that actually make sense for your advertising.
Average ROAS Benchmarks By Industry
While every business has its own unique math, taking a look at industry averages can give you a solid starting point. This isn't about finding a number to copy, but about getting a feel for the landscape and setting a reasonable baseline for your own goals.
Here’s a general look at what performance looks like across different sectors.
Industry | Average ROAS Target | Key Considerations |
|---|---|---|
E-commerce & Retail | 4:1 to 6:1 | Heavily dependent on profit margins and product cost. High-volume, low-margin businesses need a higher ROAS. |
B2B Services & SaaS | 3:1 to 5:1 | Often focused on lead value and LTV. A lower initial ROAS is acceptable if it leads to high-value, long-term contracts. |
Healthcare & Medical | 7:1 to 10:1 | High-value procedures and patient lifetime value allow for a much higher return, but lead costs can also be very high. |
Legal Services | 5:1 to 8:1 | Similar to healthcare, the value of a single new case or client is substantial, justifying higher ad spend for a strong return. |
Real Estate | 8:1 to 12:1 | Driven by large commission values from property sales or rentals. Even a few closed deals can generate a massive ROAS. |
Remember, these are just averages. The most important number you need to know is your own break-even point. If your profit margin is 25%, your break-even ROAS is 4:1 ($1 / 0.25). Anything above that line is pure profit.
Historically, targeting a 4:1 ROAS has been a classic rule of thumb in ecommerce, especially for paid search campaigns. It’s long been seen as a practical baseline for profitability. This figure, often cited in industry analysis like that from Innerspark Creative, helps ground your expectations and gives you a solid foundation when launching new campaigns.
The Hidden Story Behind Your ROAS Metric
Return on Ad Spend is a fantastic starting point. It’s the go-to metric for a quick pulse check on an ad campaign, answering the simple question, "For every dollar I put in, how many dollars did I get back?"
But treating ROAS as the ultimate truth can be a costly mistake. A high ROAS looks great on a report, but it doesn't always tell you if you're actually making money or building a business that will last.
Relying on ROAS alone is like judging a car's quality just by its gas mileage. Sure, MPG is important, but it tells you nothing about the engine's health, its safety features, or whether it will leave you stranded in a year. ROAS gives you a snapshot, not the full movie. It completely ignores critical factors like profit margins, customer loyalty, and how people actually decide to buy something.
Making big decisions based on this one number can trap you in a cycle of short-term thinking, causing you to chase immediate wins that might sabotage your long-term growth.
The Profitability Blind Spot
The single biggest flaw in ROAS is that it tracks revenue, not profit. It’s entirely possible for a campaign to have an impressive 5:1 ROAS and still be quietly losing money if your profit margins are thin.
This is a trap a lot of businesses fall into. They see a good ROAS, so they pour more money into a campaign that looks like a winner on the surface but is actually draining their bank account.
That’s where a much smarter metric comes in: Profit on Ad Spend (POAS). Instead of revenue, POAS looks at the actual profit generated after you account for the Cost of Goods Sold (COGS). The formula is simple: POAS = (Revenue – COGS) / Ad Spend.
By shifting your focus from top-line revenue to bottom-line profit, you get a much clearer, more honest view of how your ads are performing. It’s the difference between knowing you’re busy and knowing you’re profitable.
Attribution: The Tangled Web of Influence
Think about the last time you bought something online. Did you see one ad and immediately click "buy"? Probably not.
The modern customer journey is a winding road. A buyer might see your ad on Instagram, search for your brand on Google a week later, get hit with a retargeting ad on Facebook, and finally make a purchase after watching one of your YouTube videos. So, which ad gets the credit? This is the core challenge of attribution modeling.
Most ad platforms, by default, use a "last-click" model. This gives 100% of the credit to the very last touchpoint before the sale. It’s a simple model, but it’s deeply flawed.
It completely ignores all the earlier ads that introduced the customer to your brand in the first place.
It massively overvalues ads at the bottom of the funnel (like branded search) and undervalues campaigns designed to build awareness.
It can trick you into cutting the budget for channels that are critical for filling your pipeline, just because they don't drive the final click.
A campaign with a low last-click ROAS might be the single most important driver of new customer discovery. If you cut it, your entire funnel could dry up over the next few months.
The Long Game: Customer Lifetime Value
ROAS has another huge blind spot: Customer Lifetime Value (LTV). LTV measures the total profit you can expect from a single customer over their entire relationship with your brand. When you obsess over getting a high ROAS right away, you risk attracting the wrong kind of customer.
Let’s look at two campaigns:
Campaign A (The "Discount Chaser"): You spend $1,000 and generate $5,000 in immediate revenue, for a slick 5:1 ROAS. But these customers are one-and-done deal-seekers who make a single $50 purchase and never come back. Your Total LTV from this group is $5,000.
Campaign B (The "Brand Loyalist"): You spend $1,000 and only generate $3,000 in revenue, for a seemingly weaker 3:1 ROAS. But these customers love your product. Over the next year, they each make four more $75 purchases. Your Total LTV from this group skyrockets to $15,000.
Looking only at the initial ROAS, Campaign A seems like the obvious winner. But in reality, Campaign B is three times more valuable to your business. By focusing only on that first transaction, you would have scaled the campaign that brought in less profitable customers and missed the goldmine.
This trade-off between immediate ROAS and long-term LTV is a critical strategic decision. It requires you to look beyond the dashboard numbers and understand what truly drives sustainable growth for your business.
Actionable Strategies To Increase Your ROAS
Knowing your Return on Ad Spend is one thing. Actually improving it is where the real work begins. If your ROAS is low, don't think of it as a failure—see it as a diagnostic tool that’s pointing you exactly where you need to focus. By methodically tuning each piece of your advertising funnel, you can transform underperforming campaigns into reliable profit engines.

There's no magic bullet for improving ROAS. It’s all about making a series of smart, incremental improvements across your campaigns that build on each other over time. Let’s break down the four core pillars where you can make the biggest impact.
Sharpen Your Audience Targeting
The absolute fastest way to burn your ad budget is to show your ads to the wrong people. Every wasted impression and irrelevant click is an enemy of a healthy ROAS. Nailing down your audience targeting ensures every dollar is spent reaching users who are actually likely to convert.
This isn't about broad demographics anymore. You have to dig into the granular signals of intent.
Implement Negative Keywords: Get serious about adding keywords for searches you don't want to show up for. If you sell luxury watches, you should be adding negative keywords like "cheap," "repair," and "free." This simple move filters out users with the wrong intent and instantly cuts wasted spend.
Leverage Retargeting Segments: Stop retargeting every single person who visits your site. That's lazy. Instead, create specific audiences based on what they did, like "added to cart but didn't buy" or "viewed X product category." This lets you serve hyper-relevant ads that speak directly to where they left off.
Build Lookalike Audiences: Take your list of best customers and let platforms like Facebook and Google build lookalike audiences from it. The algorithm analyzes the traits of your top buyers and then goes out to find brand new users who share those exact characteristics. This is how you dramatically improve the quality of your prospecting.
When you tighten up your targeting, your cost per acquisition drops. Your message connects. And your ROAS goes up. It's a direct path.
Enhance Your Ad Creative And Copy
Okay, you've found the right audience. Now you have to actually get their attention. Your ad is the first handshake with a potential customer; if it’s weak, generic, or confusing, they’ll just scroll right past without a second thought.
Great ad creative isn’t just about looking good—it’s about stopping the scroll and creating an immediate connection. Some studies show that ads with strong, clear visuals and headlines can see up to 50% higher engagement than their generic counterparts.
Here’s how to make your ads work harder for you:
A/B Test Everything: Never assume you know what works. Constantly test different headlines, images, calls-to-action (CTAs), and formats. A tiny tweak, like changing "Buy Now" to "Shop The Collection," can have a massive impact on your conversion rate.
Focus on a Single, Clear CTA: Don't confuse people by asking them to do three different things at once. Every ad should have one goal, whether it's "Learn More," "Get a Quote," or "Download Now." A focused message eliminates friction and guides the user exactly where you want them to go.
Align Ad Scent: This one is crucial. The message and vibe of your ad must perfectly match the landing page it leads to. If someone clicks an ad for red running shoes and lands on your generic homepage, that disconnect will make them bounce immediately. You just paid for a click that had zero chance of converting.
Optimize Your Landing Page Experience
You could have the best targeting and the most creative ad in the world, but if your landing page is slow, clunky, or untrustworthy, you will lose the sale. Full stop. The landing page is where the conversion actually happens, and a seamless experience here is non-negotiable for a high ROAS.
Think about this: even a one-second delay in page load time can slash conversions by 7%. A slow website is a direct saboteur of your ad performance.
Your page has to be fast, clear, and laser-focused on a single conversion goal. A key part of the puzzle is to boost your ROAS through landing page relevance to see a direct lift in your campaign results.
Use Smart Bidding Strategies
Modern ad platforms are powered by machine learning algorithms that can optimize your bids in real-time way more effectively than any human ever could. Shifting from manual bidding to automated or "smart" bidding strategies is one of the most powerful levers you can pull to improve your ROAS.
Platforms like Google Ads offer bid strategies built for specific goals:
Target ROAS (tROAS): You tell the platform your target return, and its algorithm automatically adjusts bids to hit that number. This is perfect for e-commerce brands that need to maintain a specific profit margin.
Maximize Conversion Value: This strategy tells the algorithm to get the most revenue possible out of your budget. It will automatically bid higher for users it thinks are likely to make larger purchases.
By feeding the platform clean, accurate conversion data, you empower its algorithms to make thousands of micro-adjustments on your behalf. This ensures your budget flows to the most profitable opportunities, removes the guesswork, and consistently pushes your ROAS higher.
Common Questions We Hear About ROAS
Once you start digging into Return on Ad Spend, a few questions always pop up. It’s one of those metrics that seems simple on the surface, but the real magic is in understanding its nuances.
Think of this as your quick-reference guide. We’ll cut through the noise and give you straight answers to the most common sticking points we see with our clients every day.
What's The Difference Between ROAS And ROI?
People often use ROAS and Return on Investment (ROI) interchangeably, but they measure completely different things. One gives you a tactical, in-the-trenches view of your ads, while the other gives you the 30,000-foot strategic view of your business.
ROAS is your campaign-level magnifying glass. It asks a very specific question: "For every dollar I put into this ad campaign, how many dollars in revenue am I getting back?" It’s a pure-and-simple calculation based on just two things: the gross revenue from your ads and how much those ads cost.
ROI is the wide-angle lens for your entire business. It answers the big question: "Are we actually profitable?" ROI accounts for all your costs—not just ad spend. We’re talking about the cost of your products, software subscriptions, team salaries, office rent, you name it.
In short, ROAS tells you if your ads are effective. ROI tells you if your business is making money.
How Do I Actually Track ROAS Accurately?
Look, if your tracking is off, you might as well be flying blind. Accurate ROAS tracking is the absolute foundation for making smart decisions with your ad budget. It all comes down to a solid technical setup that connects what people do on your site back to the specific ads they clicked.
Here’s the non-negotiable checklist we use:
Get Your Pixels in Place: First thing's first. You need the tracking pixels from your ad platforms—like the Meta Pixel or the Google Ads tag—installed correctly on every single page of your website. This is what lets the platforms see what’s happening after the click.
Define Your Conversion Events: What action equals money for your business? For an e-commerce brand, it's a "Purchase" event. If you're generating leads, it might be a "Form Submission" or a "Booked Call" event. You have to tell the platforms what to count.
Pass Back Real Revenue Values: This is where so many people mess up. For e-commerce, your setup must send the actual shopping cart value back to the ad platform with every purchase. For lead gen, you need to calculate an average value for each lead based on your sales team's close rate and the average customer lifetime value.
If any of these pieces are missing, your ROAS numbers are just guesswork. And guesswork is a fast way to lose a lot of money.
Can I Have A High ROAS And Still Lose Money?
Yes, you absolutely can. This is probably the most dangerous trap you can fall into with ROAS. Your ad dashboard can be glowing with a fantastic ROAS number, all while your business is quietly bleeding cash.
How? It all comes down to your profit margins.
Let's say your business has a 25% profit margin. To figure out your break-even ROAS, you just do a little math: 1 divided by your profit margin (1 / 0.25). That gives you 4. This means you need a 4:1 ROAS just to break even.
If your campaign is hitting a 3.5:1 ROAS, the ad platform will report it as a success because revenue is coming in. But in reality, you are losing money on every single sale that ad generates. You have to know your break-even number.
Should I Always Chase The Highest Possible ROAS?
It feels like the right answer should be "yes," but it’s actually a firm no. Obsessing over the highest possible ROAS is a classic rookie mistake that can seriously stunt your company’s growth.
An insanely high ROAS—think 15:1 or 20:1—is usually a sign that you’re only targeting the easiest, most obvious customers. You're picking all the low-hanging fruit. While it feels great and looks profitable on a small scale, you’re leaving a massive amount of potential revenue on the table and putting a hard cap on how big you can grow.
The smarter play is to find your minimum profitable ROAS—that break-even point we just talked about—and then pour as much fuel on the fire as you can while staying above that number. This strategy shifts the focus from efficiency to maximizing total profit and market share, which is how you build a real, scalable business.
Ready to move beyond guesswork and achieve predictable, profitable growth with your ad campaigns? The team at Wojo Media specializes in optimizing the four pillars of performance advertising—your offer, landing pages, omnipresent ads, and data—to deliver scalable results. Book a free demo call with us today to receive a custom paid ads strategy and see how we can bolt onto your brand to drive real ROI.
Comments