.png)
Conversion Rate Optimization Ecommerce: The 2026 Playbook

You've probably seen the pattern. Paid traffic keeps growing, platform dashboards look healthy, and the team asks for another budget increase. Yet contribution margin gets thinner, refunds become more painful, and the owner starts wondering whether the algorithm is the problem.
The algorithm may be doing exactly what it was asked to do. If the store leaks revenue after the click, more traffic feeds the leak. Conversion rate optimization ecommerce is the discipline that determines whether paid acquisition creates profitable customers or just impressive reporting.
The Moment CRO Stops Being Optional
A typical scaling week starts with a reassuring dashboard. Meta reports purchases, Google shows efficient campaign economics, and the blended conversion rate appears stable. Then finance reconciles payment fees, discounts, shipping subsidies, refunds, and product costs. The business has acquired more customers, but each customer contributes less margin.
That's when the team usually reaches for a familiar explanation: creative fatigue, rising CPMs, weaker audiences, or an unpredictable platform. Those issues can matter, but they're often easier to discuss than the store experience itself. A campaign can produce qualified intent and still lose the sale through unclear shipping costs, a weak offer, a slow mobile product page, or a checkout that asks too much.
Baymard's research gives the problem useful scale. Its global average cart-abandonment rate is 70.19%, calculated from 49 studies conducted between 2006 and 2023. The reported range runs from 55% to 84.27%, which is why a benchmark should guide investigation rather than become a target. Baymard's checkout usability research also makes clear that cart creation isn't the same as commercial success.
The paid media blind spot
Ad platforms optimize around the events and signals they can observe. Your business needs to optimize around contribution margin, incremental first purchases, repeat orders, and payback. Those aren't interchangeable outcomes.
A cheap purchase attributed to an ad may still be unprofitable after discounts and fulfillment. A campaign with weaker platform-reported return may create customers who reorder, while another campaign claims more credit for buyers who would have purchased anyway. CRO has to connect the ad promise to the post-click experience and then to the backend result.
That means this article isn't a collection of button-color tips. It's a practical operating system for paid ecommerce stores, covering the offer, landing page, creative, checkout, testing, and measurement. If you only want a redesign checklist, you can stop here. If you want to know why additional traffic isn't translating into durable profit, keep going.
What Conversion Rate Optimization Means in Ecommerce
Conversion rate optimization ecommerce is the structured process of increasing the share of paid visitors who become profitable customers, from ad exposure through repeat purchase. The key word is profitable. A higher checkout completion rate matters only when it raises revenue per visitor without weakening contribution margin, average order value, refund performance, or customer quality.
Core principle: Optimize the path to profitable customer value, not the number a platform is most eager to report.
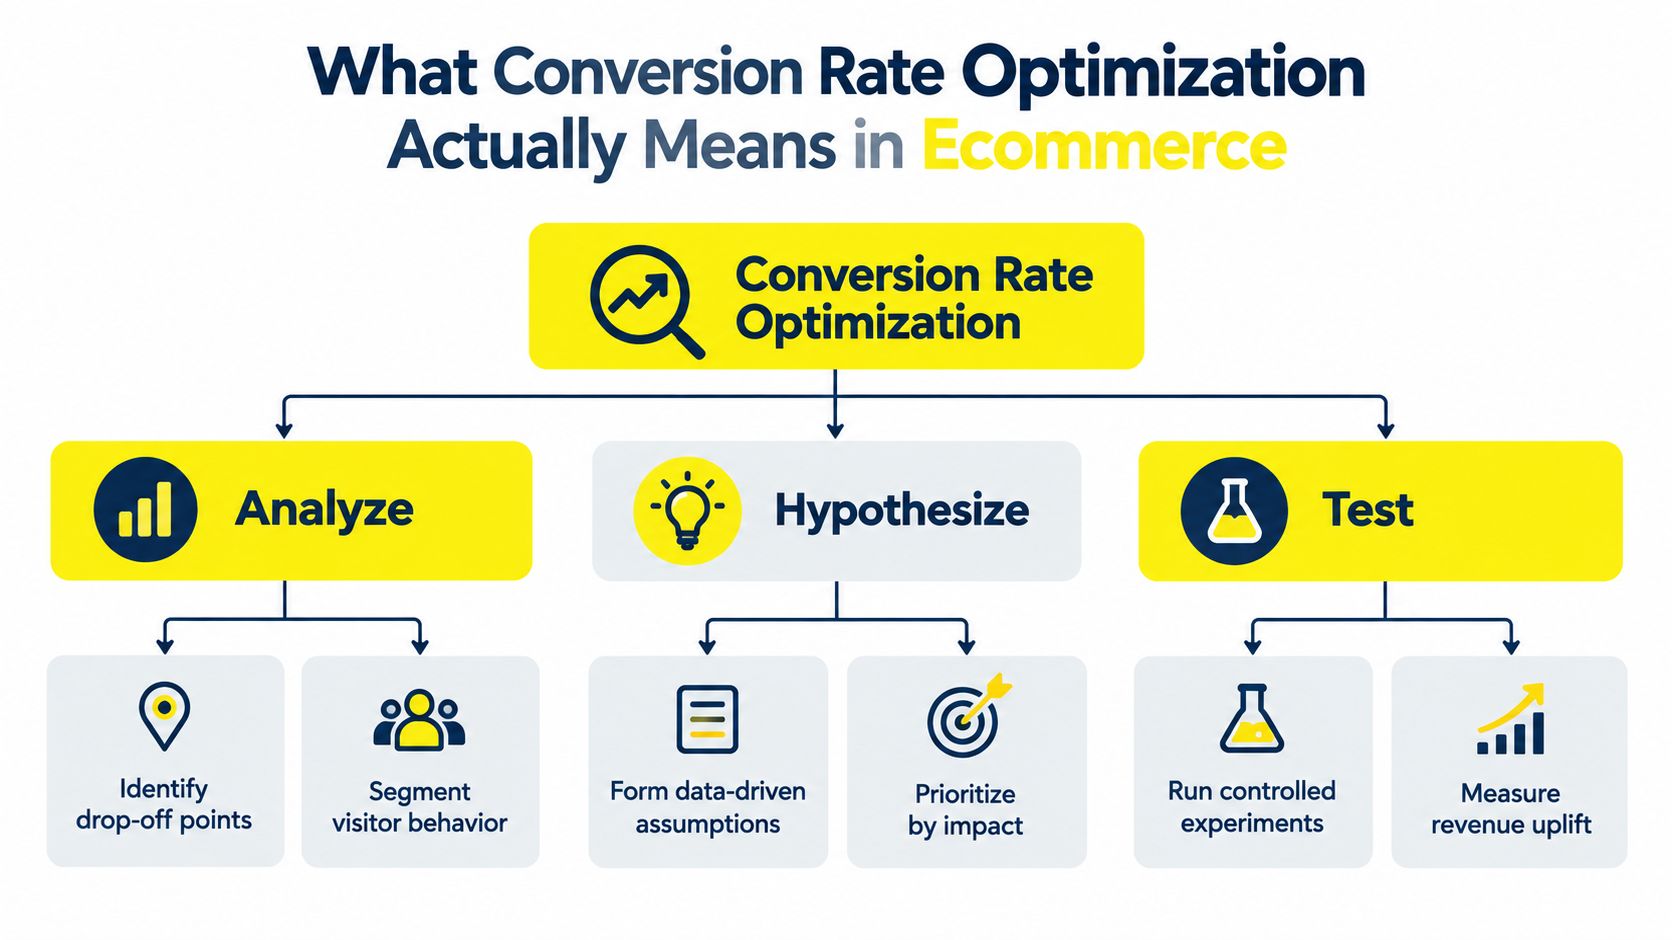
CRO is a feedback loop built around three commercial decisions:
Analyze where intent weakens and segment the behavior.
Hypothesize why the friction exists and estimate its likely business impact.
Test a focused change against revenue and margin guardrails.
Four levers control the outcome
The first lever is the offer. Price, bundle structure, guarantee, shipping promise, urgency, and perceived value determine whether the paid click was commercially viable.
The second is the landing page. It turns the ad promise into a credible buying case. Message match, product explanation, objection handling, proof, and mobile usability determine whether interest becomes consideration.
The third is the ad system. Ads set expectations before the visitor arrives. A broad creative may attract curiosity while sending visitors to a generic product page, increasing traffic but reducing intent quality. Creative angles, audience context, and landing-page continuity therefore belong in one CRO review.
The fourth is data. Analytics identifies where users leave, while usability observation, customer questions, session evidence, and backend revenue help explain the cause. Nielsen Norman Group's findings draw on five research rounds involving representative users testing more than 350 ecommerce websites across the United States, United Kingdom, Denmark, India, and China. Its ecommerce user-experience research supports combining behavioral data with direct evidence from users.
A practical definition is simple: CRO makes each qualified visit more commercially productive by removing friction and improving the offer across the buying journey. That means judging tests by incremental first purchases, contribution margin, and later customer value, rather than celebrating a platform-reported conversion-rate lift in isolation.
The Full Funnel From Ad Click to Repeat Order
A typical ecommerce dashboard ends its story at add to cart, leaving payment failures and refund-driven churn invisible. A profitable funnel runs from ad impression and click through landing-page engagement, product evaluation, cart creation, checkout, payment confirmation, and the customer's next order. Judge each stage by its effect on contribution margin and incremental first purchases, not by platform conversion rate alone.
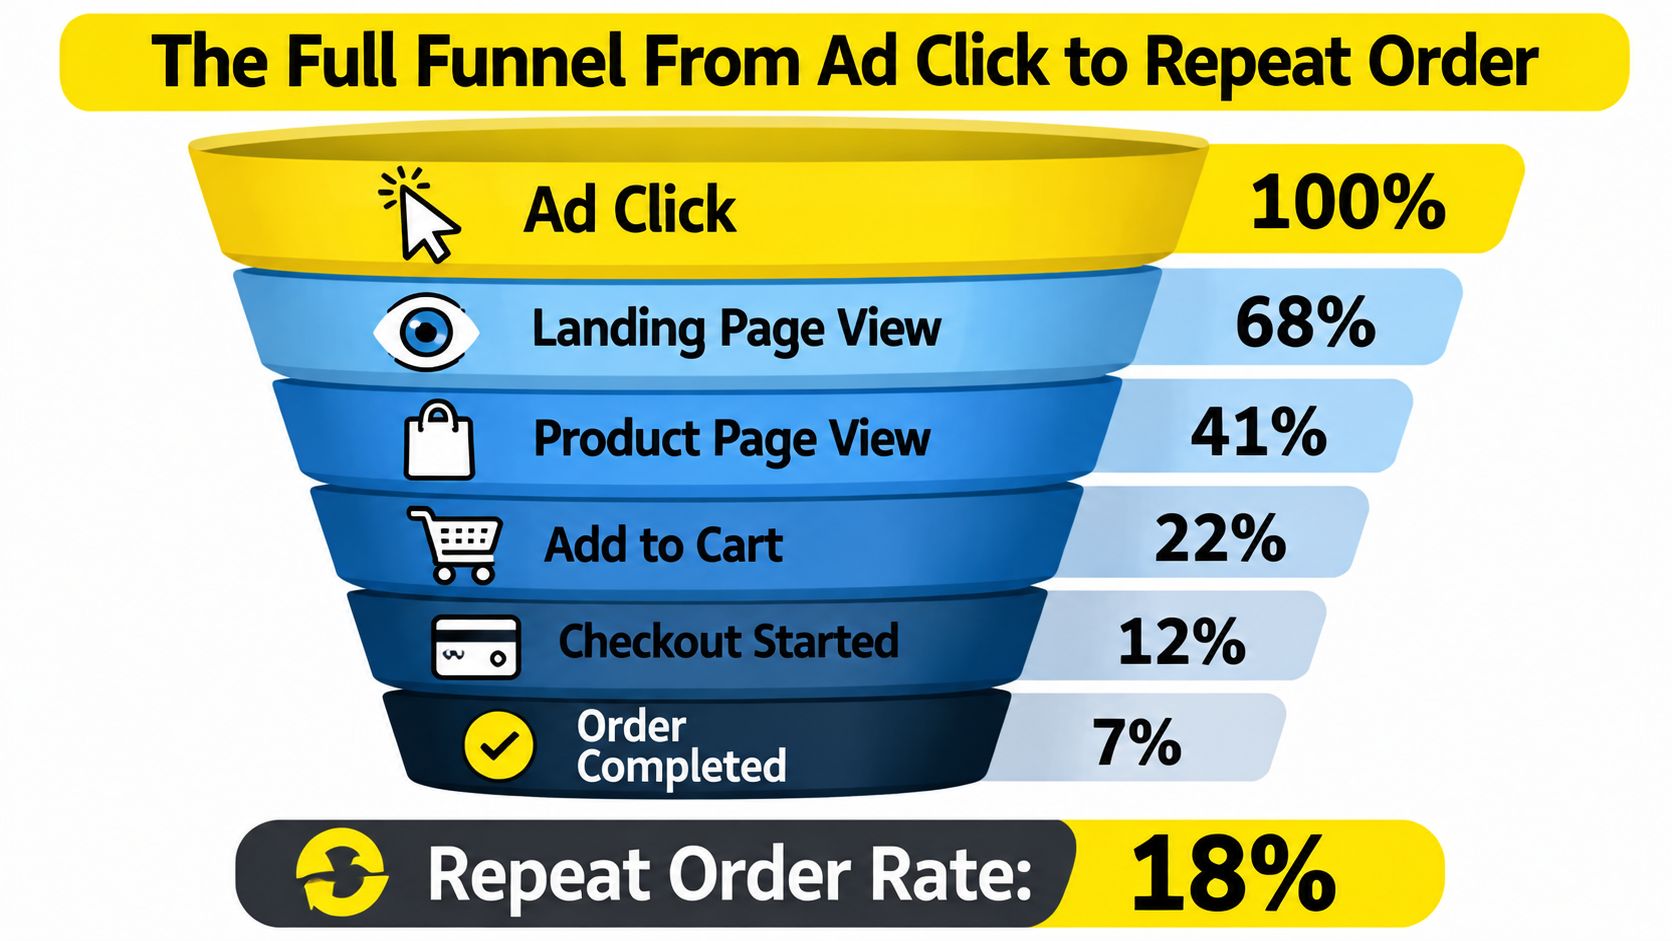
Start with the ad. Click-through rate shows whether creative earns attention, but it says little about traffic quality. Compare landing-page engagement, product-page progression, add-to-cart behavior, and contribution margin by campaign. Cheap clicks from low-intent visitors can make an acquisition asset look efficient while reducing revenue per visitor.
The landing page must deliver the promise made in the ad immediately. Review landing-page view quality, product-page progression, scroll behavior, and exits. Strong ad engagement followed by weak offer comprehension usually points to message mismatch, not a media-buying problem.
Find the first meaningful leak
On the product page, monitor variant selection, image interaction, review engagement, add-to-cart rate, and support questions. A strong add-to-cart rate with weak checkout initiation points toward cart friction or late cost disclosure. A weak add-to-cart rate points earlier, toward offer clarity, proof, product explanation, or traffic quality.
At checkout, separate checkout start, payment information submission, payment authorization, and completed order. A drop between payment submission and confirmation can indicate payment failure, technical bugs, fraud rules, or an unclear error state. Route that evidence to product or engineering instead of asking the creative team to solve a payment problem.
Repeat purchase needs its own cohort view. A first order may be acquired efficiently yet produce weak long-term value if customers do not return, dislike the product, receive poor support, or request refunds. Measure new-customer contribution margin, first-order revenue per visitor, refund behavior, and repeat purchasing by acquisition source.
Funnel stage | Primary diagnostic metric | Decision it supports |
|---|---|---|
Ad exposure and click | Qualified click-through rate | Whether creative attracts commercially relevant demand |
Landing page | Product-page progression rate | Whether the page clarifies the ad's promise |
Product page | Add-to-cart rate and review engagement | Whether value and risk are clear |
Cart | Checkout-start rate | Whether cost and delivery expectations hold |
Checkout | Payment authorization rate | Whether buyers can complete payment |
Repeat order | Repeat-purchase rate by cohort | Whether acquisition creates durable value |
Use consistent segmentation across the funnel. Compare device, browser, traffic source, product, geography, new versus returning customers, and payment method. For post-purchase feedback, Bragly's review funnel tool can organize the review request path. Treat review volume as input for product and experience decisions, not as the outcome itself.
Prioritize the leak that blocks the most profitable demand. The easiest page to change is rarely the highest-value test. Fixing payment authorization, poor traffic quality, or weak repeat purchase can contribute more margin than polishing a page with an already healthy progression rate.
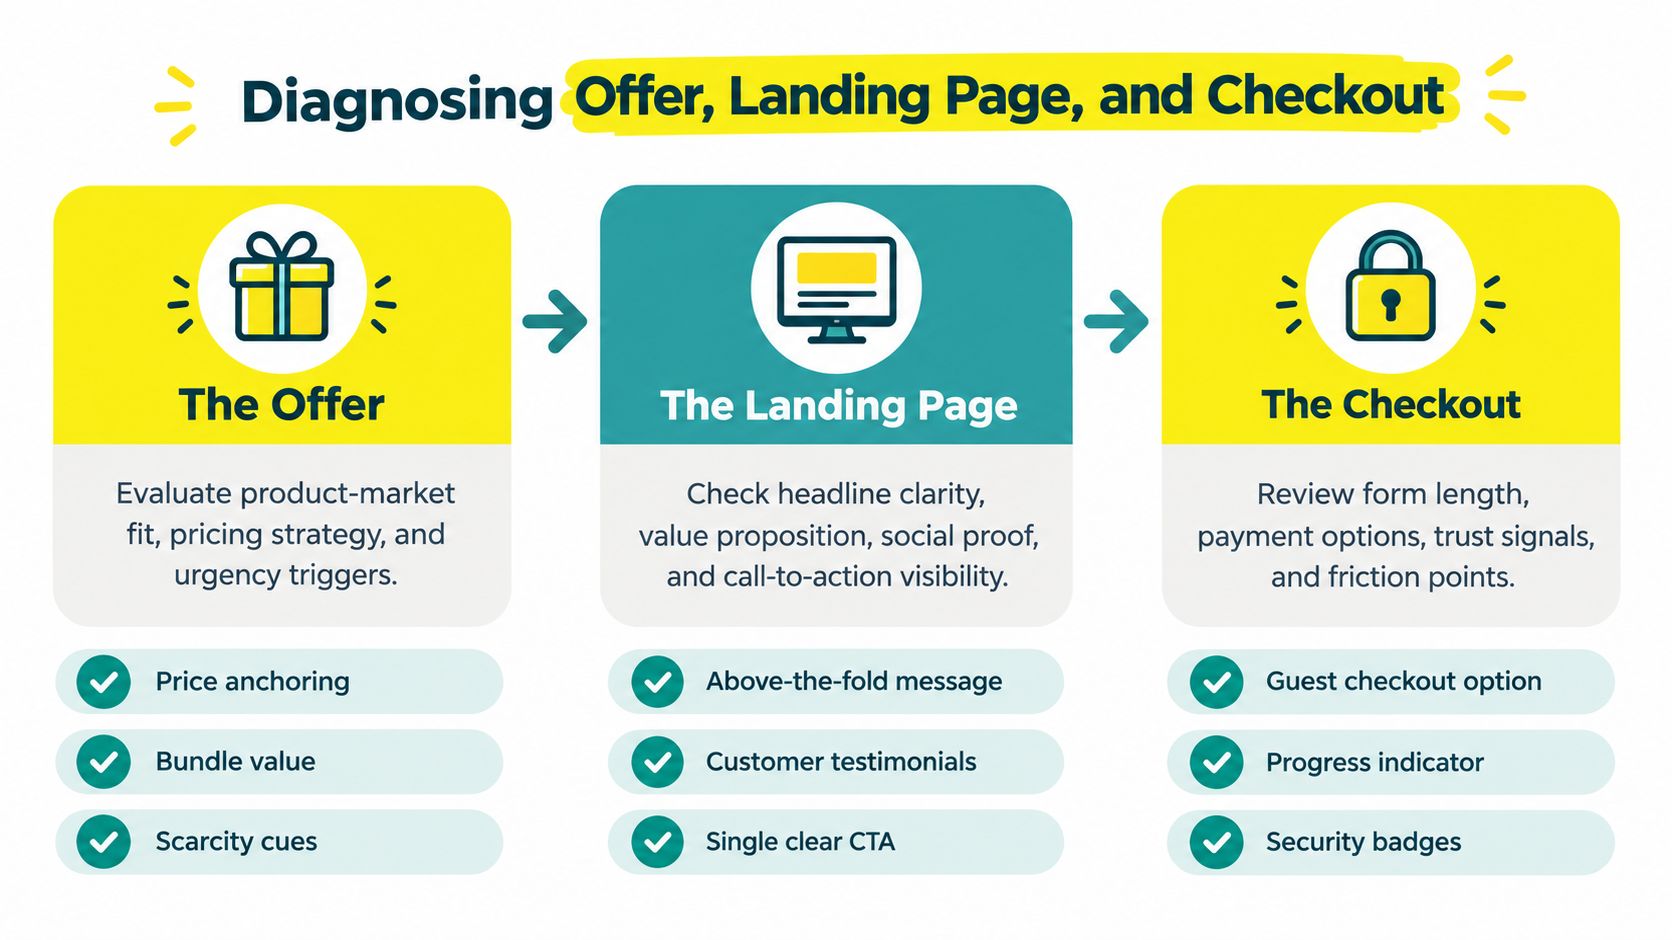
Diagnosing Offer, Landing Page, and Checkout
A store can have a polished interface and a weak conversion system. The sequence matters because the offer determines the ceiling, the landing page frames the decision, and checkout captures the demand that survives both.
Start with the offer
Open the ad and landing page side by side. Can a shopper identify the same product, outcome, price logic, guarantee, and delivery promise in both places? If the ad sells a specific use case and the page opens with generic brand language, the visitor has to reconstruct the reason to buy.
Audit the offer for:
Price anchoring: Does the comparison clarify value without making the original price look artificial?
Bundle value: Does the bundle solve a larger problem or merely add items?
Risk reversal: Are returns, guarantees, delivery, and support easy to understand?
Urgency: Is scarcity genuine and operationally defensible?
Margin protection: Does the discount or bundle preserve contribution margin?
The highest-impact change is often not a new headline. It's a clearer reason to buy now, presented in terms the target customer already understands.
Then inspect the landing page
Review the page on a phone using a cold visit from the actual ad. Above the fold, identify the product, audience, outcome, price or pricing logic, and primary action. If any of those require scrolling or interpretation, fix the hierarchy before adding more sections.
Next, classify objections. Shoppers may question fit, quality, ingredients, durability, delivery, returns, compatibility, or whether the product works for their situation. Answer those questions near the decision point with credible reviews, demonstrations, comparisons, specifications, or customer-generated content. Product video can be especially useful when the product's value is difficult to communicate through static imagery, and Moonb's product video services provide a relevant production option.
Finish at checkout
Audit guest checkout, address autocomplete, autofill, field-level errors, shipping disclosure, payment methods, and account creation. Baymard reports that 65% of evaluated checkout experiences are mediocre or worse, while only 2% qualify as good. It also estimates approximately 32 actionable checkout improvements for the average large ecommerce site and a possible 35% conversion-rate increase through better checkout UX alone. Baymard's checkout benchmark supports treating checkout as a primary revenue project, not a final polish task.
Baymard also reports that 14% of users abandon checkout when a phone number is required without an explanation, while 39% of ecommerce sites fail to explain the request. The fix is not always removing the field. Sometimes the right change is explaining why it's needed, making it optional, or collecting it later.
Prioritize in this order: offer, landing page, checkout. A better checkout can't rescue an offer that attracts the wrong buyer, and a beautiful landing page can't compensate for an offer nobody believes.
An A/B Testing Framework That Ties to Revenue
A test can be statistically tidy and commercially useless. A winning variant can raise the purchase rate while lowering average order value, increasing refunds, or attracting customers with weaker repeat behavior. The testing program needs a financial center of gravity.
Write each experiment in one sentence:
If we change X for Y visitors, we expect Z to improve because evidence indicates specific friction.
For example, if users hesitate at a required field, test a shorter or better-explained form. If a product page receives strong traffic but weak cart progression, test the offer framing or proof, not a random button color.
Choose the right scorecard
Set one primary metric, then add guardrails. Revenue per visitor or contribution margin per session can serve as the commercial outcome. Completed orders per checkout session may be a useful diagnostic. Average order value, refund behavior, payment success, and customer-support contacts protect against false wins.
Baymard reports that the average US checkout displays 23.48 form elements by default, while an effective checkout can be as short as 7 to 8 actual form fields. Its research also found that 17% of US online shoppers abandoned an order because checkout was too long or complicated. The Baymard cart-abandonment research makes form complexity a testable hypothesis, not a matter of aesthetic preference.
A practical brief includes:
Business question: What decision will this test inform?
Treatment: What exactly changes, and for whom?
Primary metric: Which commercial result decides the test?
Guardrails: Which outcomes must not deteriorate?
Segments: Which devices, products, or traffic sources require separate analysis?
Decision rule: What will you ship, reject, or investigate next?
Match the test to the uncertainty
Use a landing-page test when you're unsure whether the message or structure is suppressing demand. Use an offer test when price, bundle, guarantee, or urgency may be the bottleneck. Use a checkout split when the friction is operational or interaction-based. Use a creative test when the quality of traffic or promise alignment is uncertain.
Don't split traffic across a long list of low-impact experiments. Sequence the highest-confidence, highest-value questions and document the result, including tests that lose. A failed test can eliminate a tempting but incorrect explanation and sharpen the next hypothesis.
Read results across normal buying conditions, not just a short favorable period. When a variant wins, validate the effect against backend contribution and repeat behavior before scaling it across campaigns.
Analytics and Attribution for a Privacy-First Store
Platform-reported conversion rate is a useful signal, but it isn't a profit statement. Privacy restrictions, consent loss, browser limits, ad blockers, modeled conversions, and cross-device journeys make user-level attribution incomplete. Treating one platform's credit as ground truth encourages budget shifts that may reward duplicated or noisy reporting.
Privacy-preserving attribution is increasingly designed to report aggregate relationships between ad impressions and conversions without identifying individual users. Guidance from the World Wide Web Consortium on privacy-preserving attribution recommends meaningful events such as first purchases, subscriptions, and repeat orders instead of granular individual trails.
Build a source of truth
Use server-side or CRM-confirmed purchases to reconcile platform data. The purpose isn't to recreate a perfect person-by-person journey. It's to establish whether campaigns create incremental customers and acceptable economics.
Build dashboards around:
First-order contribution margin: Revenue less product, fulfillment, payment, discount, and variable acquisition costs.
Revenue per visitor: A store-level and campaign-level view of traffic productivity.
Cohort value: Repeat revenue and refund behavior by acquisition source and first product.
Checkout reliability: Payment success, errors, device patterns, and browser differences.
Experiment economics: Primary test outcome alongside average order value and margin guardrails.
Use holdout or geographic tests where practical. They won't answer every attribution question, but they can challenge the assumption that every reported conversion was incremental. For visitors who decline tracking, define a fallback measurement approach instead of excluding them from commercial planning.
The trade-off is intentional. You'll know less about individual trails and more about aggregate business outcomes. That can improve decisions because the team stops reallocating budget based on conflicting platform claims.
Creative teams also need this discipline. A video can produce cheap engagement and weak customer economics, or it can generate fewer visible interactions and stronger first purchases. For a practical perspective on connecting content activity with business return, see what Klap recommends, then translate the principle into your own backend metrics.
Retire dashboards that celebrate clicks, attributed purchases, or conversion rate without margin context. Keep them as diagnostic inputs, not executive outcomes.
Your 90-Day CRO Execution Plan
A useful CRO program creates decisions in a fixed order. Don't begin with a redesign. Begin by locating the commercial leak, then remove friction, test the largest uncertainties, and install measurement that survives platform changes.
Weeks 1 and 2 focus on diagnosis
Map the funnel from ad click to repeat order. Reconcile platform purchases with payment and CRM records. Segment by device, browser, traffic source, product, and checkout step.
Deliver four artifacts:
A funnel map with every event and ownership.
An offer audit covering price, bundle, guarantee, urgency, and margin.
A checkout teardown using real mobile and desktop journeys.
A measurement reconciliation showing where platform and backend data disagree.
Weeks 3 and 4 ship quick wins
Fix broken fields, unclear errors, forced account creation, hidden shipping costs, and weak mobile interactions. Align the landing-page headline, creative promise, product proof, and primary CTA. Refresh ads only when the new creative supports a clearer offer or a defined audience objection.
At the end of week four, review shipped changes, implementation quality, and early guardrail movement. Don't declare a winner from a few encouraging orders.
Weeks 5 through 8 run the first testing sprint
Choose the strongest hypotheses from the diagnostic backlog. Test offer framing, landing-page message match, or checkout friction before low-impact visual preferences. Assign one primary commercial metric and protect average order value, refunds, payment success, and margin.
Write a short readout for every test: what changed, what happened, what the result cannot prove, and what decision follows.
Weeks 9 through 12 install the system
Move winning changes into production carefully. Build backend profitability and cohort dashboards, clean up event definitions, and document the next testing queue. Keep a record of losing tests so the team doesn't recycle the same assumptions under new designs.
The operating rule is simple: buy qualified attention, convert it with a credible offer, measure profit at the backend, and test the largest source of uncertainty first.
Wojo Media helps paid ecommerce brands connect offer strategy, conversion-focused landing pages, omnipresent campaigns, and backend KPI tracking into one operating process. If your store is scaling traffic without consistent contribution margin, visit Wojo Media to explore a practical paid ads and full-funnel growth strategy.
Comments