
How to Measure ROI on Social Media: A Step-by-Step Guide

The most popular advice about social media ROI is incomplete: track conversions, divide revenue by ad spend, and scale whatever looks strongest. That tells you what the advertising platform credited, not whether your business made money because of the ads.
A campaign can show impressive ROAS while losing money after product costs, creative fees, and purchases that would've happened anyway. Learning how to measure ROI on social media means separating attribution from causation, then checking both against your actual costs. Use platform reporting to manage campaigns. Use incremental profit to judge the investment.
Social Media ROI Formulas Compared Side by Side
Social media ROI is incremental contribution profit, minus fully loaded marketing cost, divided by fully loaded marketing cost. ROAS is revenue divided by ad spend. They aren't interchangeable.
The terminology matters. In this article, contribution profit means the money remaining after variable operating costs but before the marketing costs being evaluated. Subtract marketing costs once, not twice.
Social media ROI formulas and what each one tells you
Metric | Formula | Question it answers | Where it misleads |
|---|---|---|---|
ROI | (Incremental contribution profit − fully loaded marketing cost) ÷ fully loaded marketing cost | Did the program make money after all costs? | Needs a credible incremental estimate and a complete cost base |
ROAS | Attributed revenue ÷ ad spend | How much revenue was credited per media dollar? | Ignores margin, creative costs, and agency fees |
CPA | Ad spend ÷ conversions | What does each recorded acquisition cost? | Doesn't establish customer value or incremental impact |
Incremental ROAS | Incremental gross contribution profit from a controlled test ÷ ad spend | How much contribution profit did the ads cause per media dollar? | Requires a credible test and excludes nonmedia marketing costs from its denominator |
Define the conversion behind CPA. If you're counting form submissions, it's a lead acquisition cost, not a paying-customer acquisition cost. Calling both “CPA” without qualification makes account comparisons unreliable.
Also label whether your incremental ROAS uses revenue or contribution profit. The table uses a profit-based definition throughout.
How a strong dashboard can hide a loss
Follow a campaign through the calculation without changing the underlying sales. The platform credits revenue to the ads, producing an attractive revenue-to-media ratio. Finance then removes product costs, shipping, discounts, and refunds, leaving substantially less money available to cover marketing.
Next, add creative production and account-management costs to media spend. The apparent return shrinks again.
Finally, estimate which purchases the advertising actually caused. If a meaningful share would've happened without the campaign, the incremental contribution can fall below the fully loaded cost. The dashboard can still look strong while the business loses money.
Reporting rule: Put incremental ROI in the leadership report. Keep ROAS and CPA in the operating dashboard, clearly labeled as attributed metrics.
That distinction doesn't make platform reporting useless. It gives each metric an appropriate job: fast optimization signals for the buyer, defensible economic outcomes for the business owner.
Pick One Profit Goal and Count Your Full Costs
Start with the decision you need to make. Are you deciding whether to increase acquisition spending, improve lead quality, or stop funding an offer that can't support its advertising costs?
Choose one primary economic outcome for that decision. Keep supporting metrics underneath it rather than treating every favorable movement as proof of success.
Match the goal to the business
E-commerce: Use contribution profit after product costs, fulfillment, discounts, and refunds. Revenue alone won't tell you whether the product mix supports acquisition spending.
Local services and coaching: Connect qualified pipeline or booked appointments to realized contribution profit. Don't assume every booking becomes a paying client.
Subscriptions and courses: Use customer lifetime contribution when you have credible retention and payment history. Separate observed value from projected value.
Organic social: Include the labor and production resources used to create, publish, and manage content. Unpaid distribution doesn't mean cost-free marketing.
Write down which costs sit inside contribution margin and which sit inside marketing investment. Otherwise, someone can subtract fulfillment twice while another person leaves it out entirely.
Build a cost ledger finance can recognize
Include media spend, creative production, creator or influencer fees, agency retainers, measurement software, and allocated internal team time. Assign shared expenses using a consistent method that finance accepts, rather than changing allocations to improve a campaign's appearance.
For a revenue-based ROAS target, media-only break-even ROAS is the reciprocal of contribution-margin rate. But that threshold only covers media. Your fully loaded threshold must also account for the other marketing expenses.
Keep social connected to the wider business ledger. In Nielsen's 2024 global marketer survey, only 38% said they evaluated holistic marketing ROI by measuring traditional and digital marketing together. An isolated social dashboard shouldn't substitute for the company's financial picture.
Use this goal statement with your own figures:
We will spend our approved monthly budget to generate a defined amount of incremental contribution profit at our agreed margin, measured through reconciled customer records and a controlled test.
Add an owner, a reporting window, and a rule for handling refunds. Those details make the goal operational rather than aspirational.
How to Connect Tracking Across Platforms and CRM
Your tracking setup should let someone follow a recorded sale backward to its customer record and campaign identifiers. It should also let them explain why an advertising dashboard and the payment ledger disagree.
Build the connection before using either system to justify a larger budget.
Establish a shared tracking structure
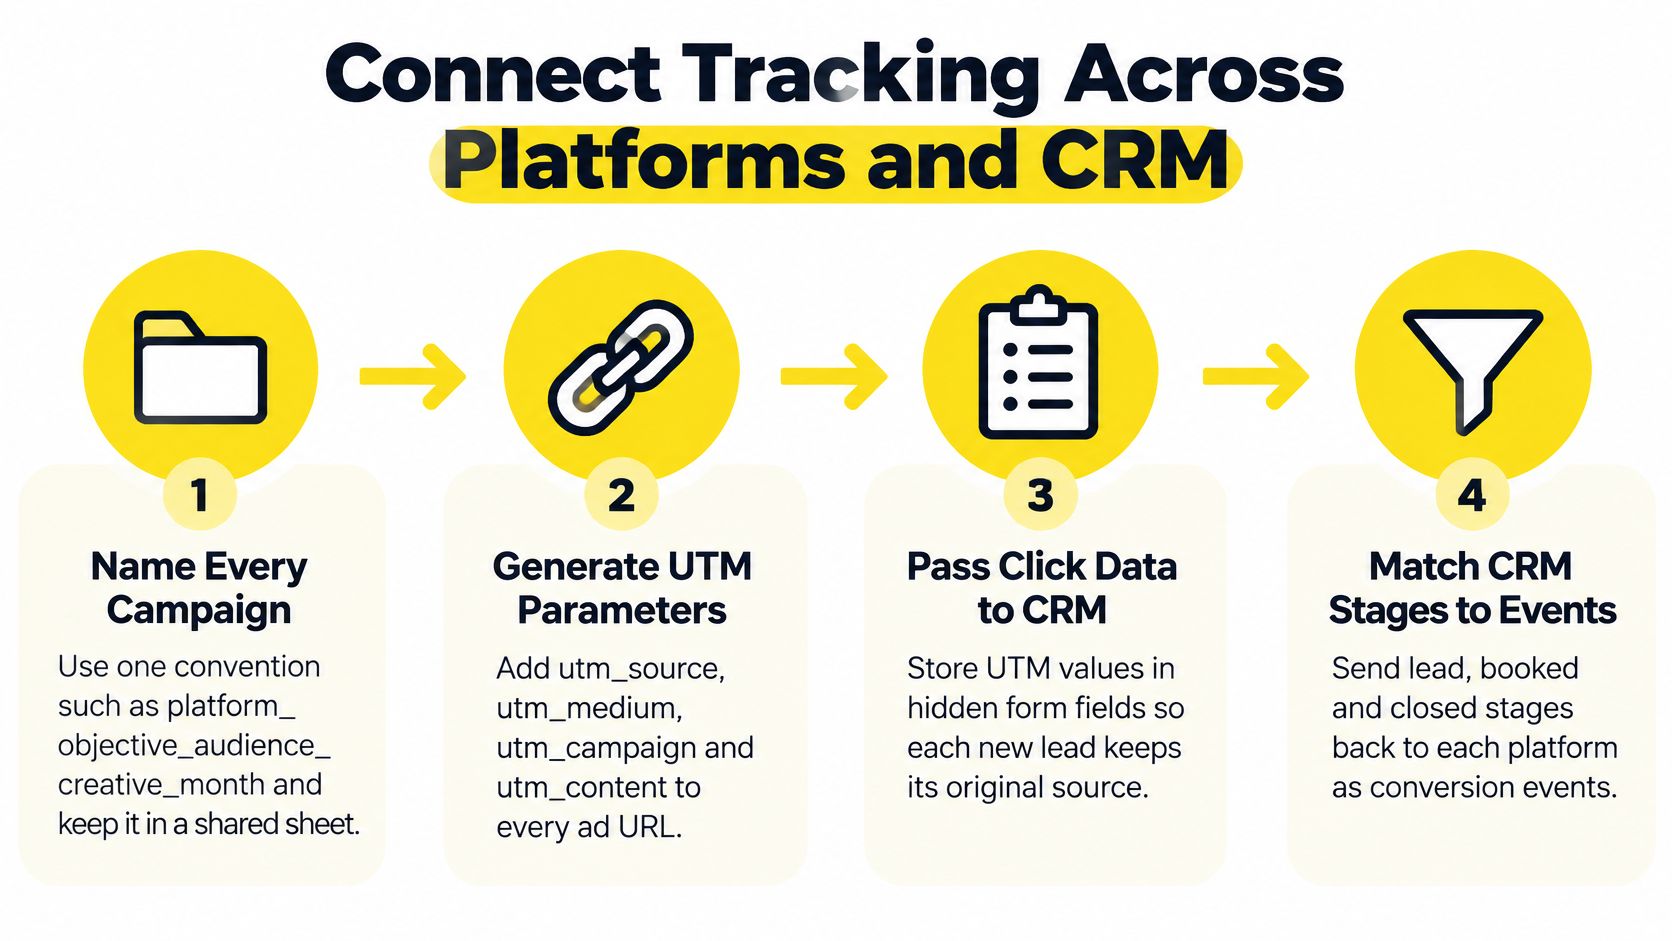
Standardize campaign names. Use a convention such as and maintain it in a shared sheet. This prevents renamed campaigns and inconsistent labels from fragmenting reports.
Generate tagged links from that sheet. Keep , , , and consistent. Treat the generator as a controlled input, not something each buyer improvises.
Define every conversion in writing. Specify what qualifies as a lead, appointment, and customer. A submitted form and a qualified prospect should remain separate events.
Use the visual workflow as an implementation checklist.
Preserve identifiers through the sale
Carry source information into the CRM. Store campaign identifiers, UTMs, available click identifiers, and timestamps with the lead. Preserve the original acquisition fields rather than overwriting them whenever the person returns.
Deduplicate conversion events. If you implement browser and server-side reporting, such as Meta Pixel alongside Conversions API, configure a shared event identifier for the same event. Check that repeated submissions or payment notifications don't create duplicate business outcomes.
Match payments to customer records. Record order identifiers, payment timestamps, refunds, and the relevant customer or lead identifier. This prevents an accepted proposal from being reported as collected revenue.
Reconcile on a regular schedule. Compare platform conversions, CRM records, and payments using the same event definitions and date basis. Investigate unexplained changes rather than adopting an arbitrary acceptable-gap percentage.
A useful reconciliation sheet separates missing records, duplicate events, timing differences, and attribution differences. Those are different problems and need different fixes.
Don't force the totals to match by editing the business data. A platform may credit a conversion under its attribution rules while finance records the payment elsewhere in time. Document the distinction, and use the payment system as the record of collected money.
Choosing an Attribution Model Without Overcrediting Social
Last-click reporting can make social look weak while a multi-touch model makes it look important. Neither result, by itself, proves that social caused the sale.
Attribution allocates credit among recorded interactions. It's useful for understanding customer journeys, but selecting a more favorable model doesn't establish a better return.
Attribution models compared for social campaigns
Model | How credit is assigned | Best for | Main blind spot |
|---|---|---|---|
Last-click | All credit goes to the final eligible click | Simple reporting and examining closing interactions | Ignores earlier discovery |
First-click | All credit goes to the first recorded touchpoint | Exploring acquisition origins | Ignores later persuasion |
Linear | Equal credit across included touchpoints | Reviewing journeys with multiple recorded interactions | Assumes equal influence |
Time decay | More credit goes to interactions closer to conversion | Examining recent touches in a consideration journey | Weights follow a rule rather than measured causal impact |
Data-driven | Contributions are estimated using account history and counterfactual modeling | Examining contribution using account-specific evidence | Depends on available observations and model assumptions |
Google Analytics' attribution documentation explains the distinction between last-click credit and data-driven attribution using account-specific historical data and counterfactual modeling. Don't mistake that modeling for a randomized campaign holdout.
The comparison table is a decision framework, not a promise that every listed model is available in every analytics product.
Compare the assumptions, not just the totals
Choose contrasting models and apply them to the same reporting period, conversion definition, and customer population. If the social contribution changes materially, identify which journey patterns explain the difference.
Treat that disagreement as model sensitivity, not a statistical confidence interval. You don't know that the causal answer lies between the models.
Review these settings before shifting budget:
Conversion eligibility: Check whether the report includes purchases, leads, or mixed events.
Click versus view credit: Keep credited ad views separate from clicked journeys where the reporting system permits it.
Lookback assumptions: Choose windows that fit your decision and document changes.
Data coverage: Check which interactions the system can observe before interpreting missing credit as missing influence.
A model that gives social more credit isn't necessarily more accurate. Choose assumptions you can defend when the result is unfavorable.
For smaller accounts, a transparent rule-based view can be easier to audit than a complicated model. Use it as an operating convention, then validate the spending decision with a controlled test.
Measuring Incremental Profit Instead of Platform Revenue
Retargeting deserves particular scrutiny. A campaign aimed at people already close to buying can receive credit for purchases without creating enough additional contribution to cover its costs.
The decision matters just as much for a small business owner as for a large acquisition team.

A 2025 Supermetrics survey found that only 8% of respondents used incrementality testing. The practical opportunity is to measure what changed because people were eligible to receive the advertising, rather than accepting every credited purchase.
Choose a design you can defend
An audience holdout randomly assigns eligible people to treatment and control groups. Use a platform conversion-lift tool where available, and evaluate people according to their assigned group rather than selecting only those who saw an impression.
A geographic test assigns geographic cells to treatment and control. Use historical sales patterns when designing comparable groups, and document other marketing activity that could affect the comparison.
A before-and-after pause can provide a directional check when stronger designs aren't feasible. Treat it cautiously: seasonality, promotions, and other changes can explain the difference without the advertising being responsible.
Calculate the economic effect
Specify the question before launch. Name the campaign, eligible population, profit metric, and decision the result will inform.
Plan assignment and duration. Choose a design that can detect an economically meaningful effect and allow enough time for the purchase journey to mature.
Measure the treatment-control difference. Incremental lift is the treatment conversion rate minus the control conversion rate, divided by the control conversion rate.
Translate conversions into contribution. Apply realized contribution profit per conversion, or compare contribution directly between appropriately normalized groups.
Subtract the marketing investment. Use the fully loaded cost base for ROI, and media spend alone for the profit-based incremental ROAS defined earlier.
Report uncertainty. Include the confidence interval, test duration, population, and relevant limitations.
If the confidence interval includes zero, the result doesn't establish a positive effect. It also doesn't prove that the campaign has no effect. Consider whether the design needs more observations, a longer window, or a narrower question before committing to another test.
Use this video alongside your test-planning notes.
The budget implication can feel counterintuitive: a campaign with lower attributed ROAS may deserve more investment if it creates more genuinely incremental contribution. Don't automatically reward the campaign that reaches customers closest to purchasing.
Tracking Leads, Calls and Sales That Close Later
A prospective med spa patient might see an ad, send a message, book a consultation, and pay after speaking with the clinician. A tax-planning prospect might register for a webinar before becoming a client. Neither journey fits neatly into an immediate website-purchase report.
Track the customer through the actual sales process.

Deloitte's 2025 social research reports that 96% of social-first brands considered social commerce a high or very high priority, while 39% said it delivered high ROI. Prioritizing the channel and proving its financial value are different tasks.
Follow the CRM stage ladder
Stage | What to record | What to examine |
|---|---|---|
Lead | Inquiry and original acquisition information | Inquiry quality and source completeness |
Qualified | Fit against documented criteria | Qualified lead rate |
Booked | Appointment and booking date | Booking rate among qualified prospects |
Showed | Attendance outcome | Show rate |
Closed | Payment and contribution profit | Close rate, time to close, and realized value |
Repeat | Further purchases and refunds | Repeat behavior and lifetime contribution |
For the med spa, cheap inquiries aren't enough. If the team books unsuitable prospects who don't attend, the campaign hasn't produced the same economic value as one that attracts fewer, better-qualified patients.
Keep the denominator visible at every stage. A close rate calculated from attended consultations answers a different question from a close rate calculated from all inquiries.
Let cohorts mature before judging them
Group leads by their original acquisition period and compare cohorts at equivalent ages. Otherwise, you'll compare a recent group with incomplete sales against an older group whose customers have had more time to purchase.
Use campaign-specific call tracking where appropriate and attach call outcomes to the CRM record. Log direct-message inquiries through the same qualification process, and ask how the customer heard about the business as a backup signal.
Keep in-platform purchases, social-assisted sales, and incrementally validated outcomes distinguishable. A later branded-search visit can appear in a social-assisted journey without establishing that social caused the purchase.
Don't turn an immature pipeline forecast into realized ROI. Show collected contribution separately from expected future value.
Build Your Monthly ROI Report and Decide Where to Spend
A useful report ends with a spending decision and its evidence. It shouldn't require the owner to interpret a collection of platform screenshots.
Start with realized economics, show attribution underneath, and state where the causal evidence remains uncertain.
Monthly social ROI report lines and action triggers
Report line | Source | Cadence | Action trigger |
|---|---|---|---|
Fully loaded cost | Ad accounts and finance ledger | Weekly | Costs rise without a corresponding improvement in realized contribution |
Attributed ROAS by platform | Ad platforms | Weekly | Attributed performance looks healthy while tested economics don't |
Incremental profit ROAS | Holdout or geographic test | Each completed test | Evidence indicates contribution doesn't cover media costs |
Qualified lead rate | CRM | Weekly | Falls below the established baseline after an offer change |
Close rate and time to close | CRM | Monthly | Lead volume increases while downstream sales performance weakens |
LTV by acquisition cohort | Payments and CRM | Monthly | Mature cohorts deliver less contribution than the acquisition plan assumes |
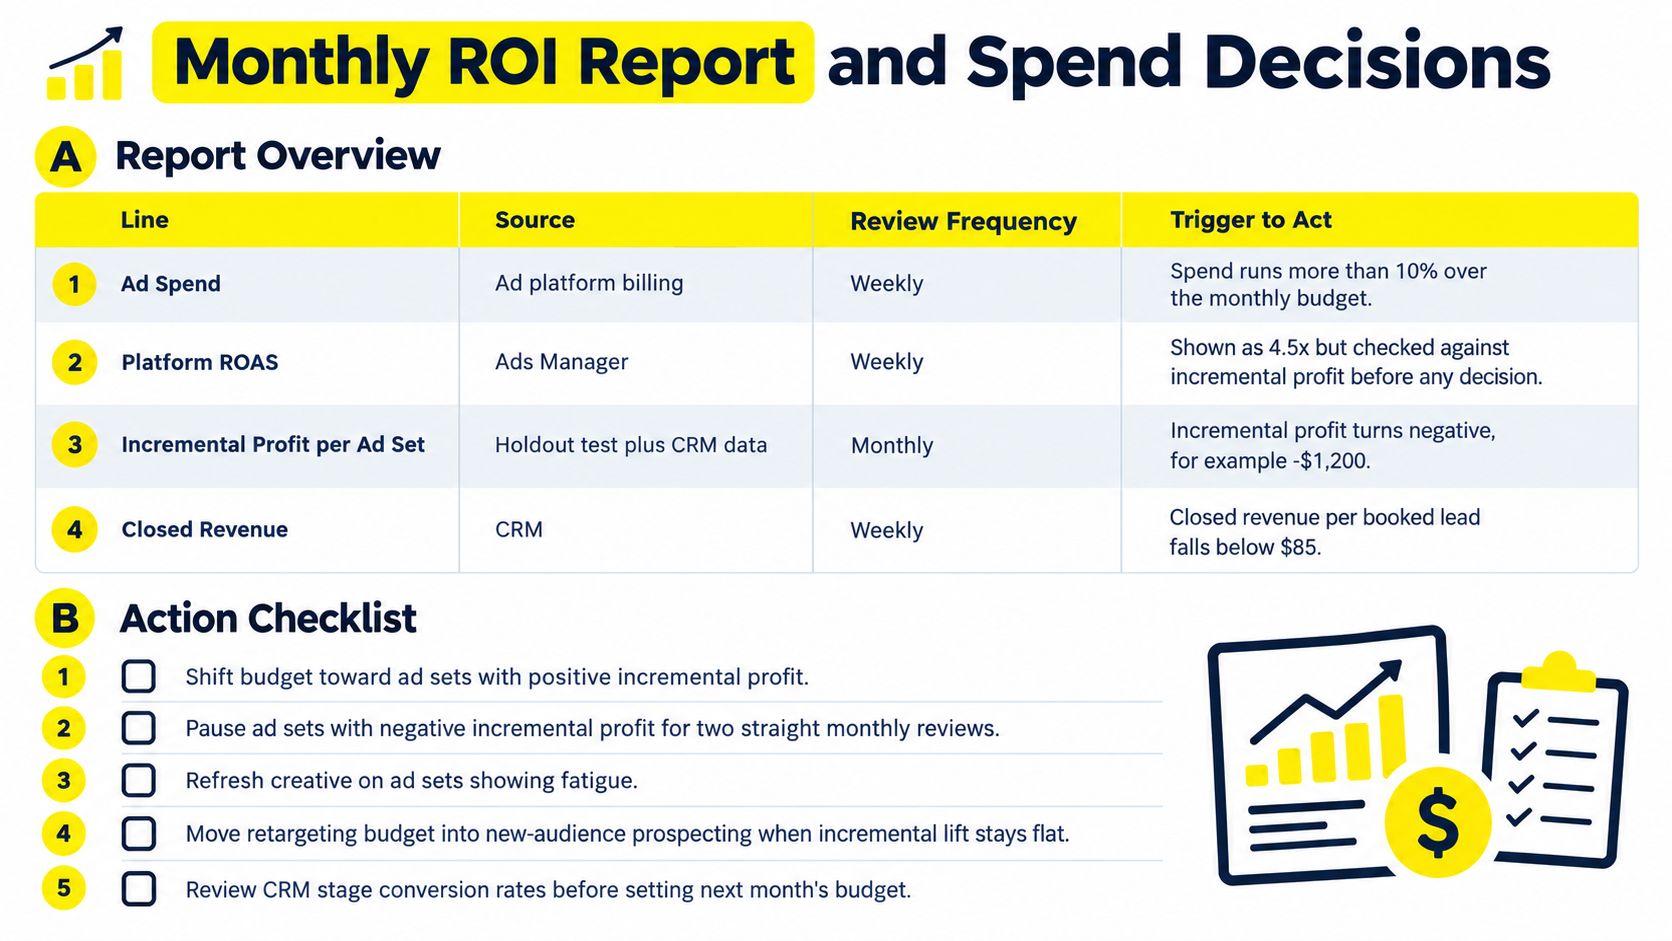
Use the visual below as a report-layout reference, not as a source of universal thresholds. Set action limits from your margins, budget constraints, and test uncertainty rather than copying illustrative figures.
Turn the report into decisions
Allocate toward demonstrated contribution. Favor campaigns with credible positive incremental economics, while checking whether the result supports the proposed spending level.
Challenge retargeting allocations. Reduce spending when controlled evidence shows little additional demand.
Inspect the offer and landing page. A decline in qualified lead rate calls for investigation before buying more traffic.
Review creative fatigue signals. Rising frequency alongside falling click-through deserves a creative review, not an automatic assumption that the audience is exhausted.
Revalidate after meaningful changes. A new offer, audience, or spending level may require a fresh test.
Roll out the process in dependency order. Agree on the profit goal and cost ledger, connect and reconcile the systems, launch a suitably designed test, and publish a report that clearly labels provisional results.
Don't force a completed causal conclusion into the first monthly report if the sales cycle or test hasn't matured. Report implementation progress, observed contribution, and the decision still awaiting evidence.
Use the same standard when evaluating an agency: ask to see event definitions, reconciliation procedures, full-cost calculations, and how its team distinguishes attributed performance from incremental profit.
If your team lacks the bandwidth to build this measurement process, Wojo Media offers a free demo call to scope a custom paid social strategy around your offer and backend KPIs. Bring your current ad reports, CRM stages, and cost breakdown so the discussion starts with how you'll judge profitable growth, not just platform ROAS.
Comments