.png)
Cross Platform Attribution for Omnipresent Ad Campaigns

A DTC skincare brand launches one hero creative across Meta, TikTok, and Google. At the end of the same seven-day reporting window, Meta claims 1,200 conversions, TikTok reports 950, and Google Ads shows 1,450. Shopify records 1,800 purchases. The dashboards don't just disagree. They collectively claim more conversions than the business received.
That situation is common in omnipresent campaigns. Each platform sees a partial journey, applies its own rules, and reports credit in a way that supports its own optimization system. Cross platform attribution starts by reconciling those claims against one canonical source of truth, then uses incrementality testing to determine which spend caused additional revenue.
When Three Dashboards Tell Three Different Stories
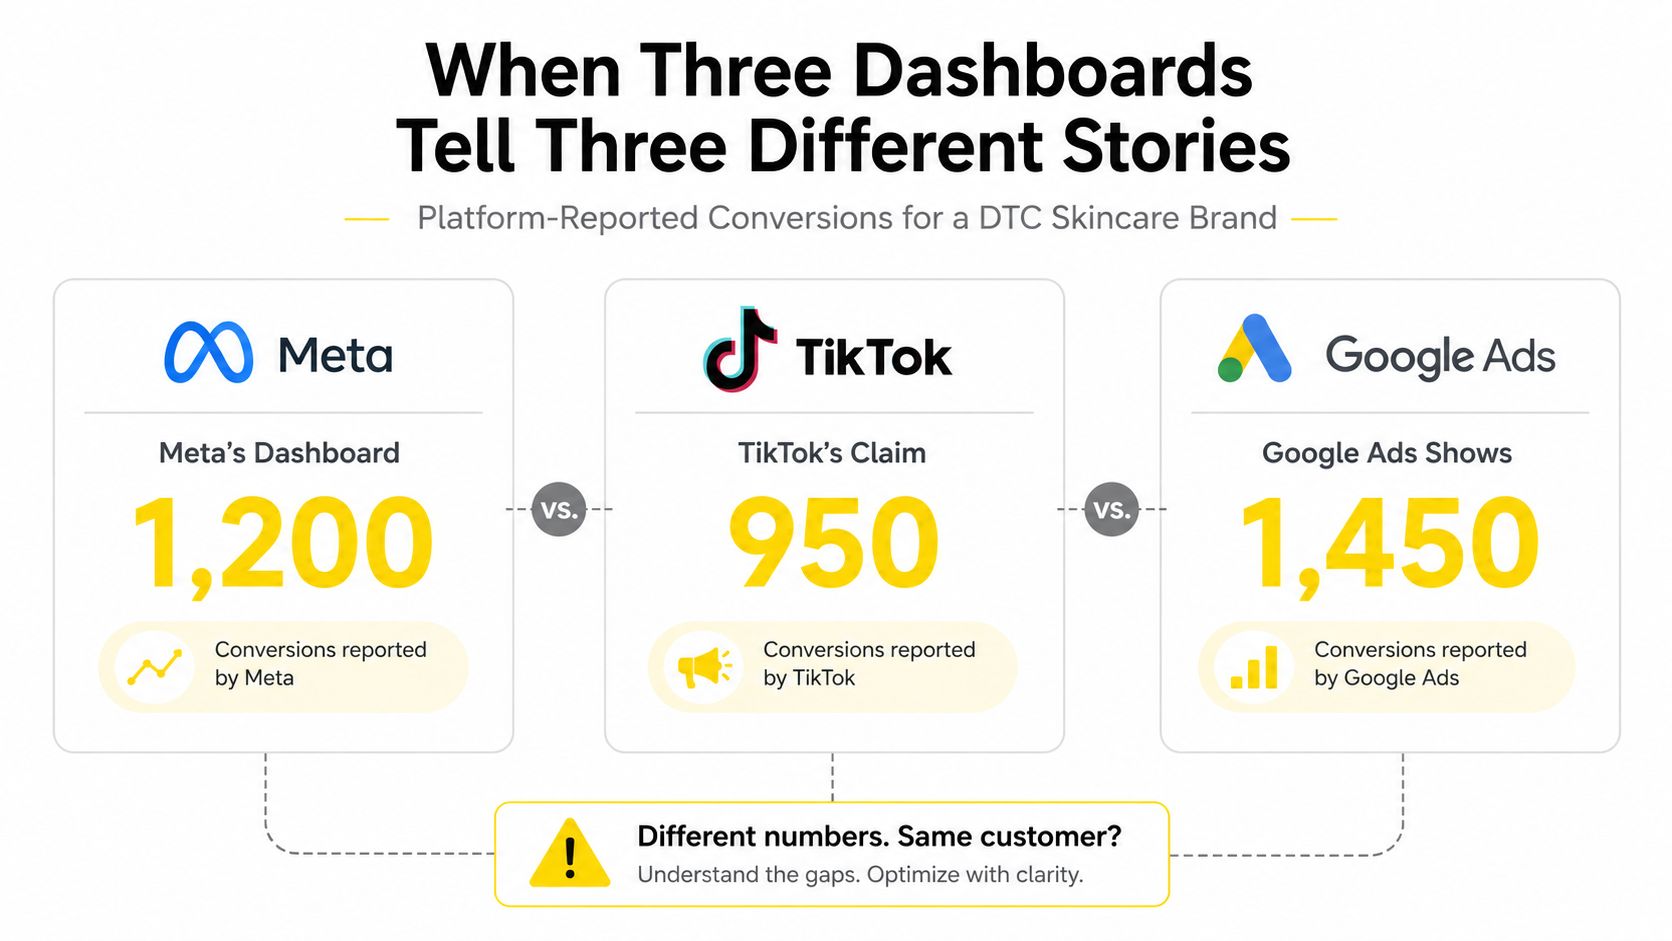
The buying team initially asks the familiar question, “Which platform is right?” That question sends teams into endless debates about attribution windows, view-through credit, click IDs, and reporting delays. The better question is, “Why can three systems claim the same purchase, and how much revenue can we verify independently?”
The Shopify order log is the commercial source of truth for completed purchases. It doesn't explain which ad caused each order, but it establishes the maximum number of purchases available for attribution. If Meta, TikTok, and Google claim more conversions collectively than the order system contains, the gap points to duplicate claims, inconsistent conversion definitions, delayed refunds, or overlapping windows.
Practical rule: Treat disagreement as a diagnostic signal, not an inconvenience to hide in a blended ROAS report.
A reconciliation-first workflow pulls raw spend, clicks, impressions where available, platform conversions, order IDs, revenue, refunds, and timestamps into a warehouse or measurement layer. The team then checks whether each platform is counting the same event, whether one order appears under multiple campaign IDs, and whether reported revenue reflects gross sales or net revenue.
The industry has moved beyond occasional experiments with multi-touch measurement. The multi-touch attribution software market was valued at $4.74 billion in 2024 and is projected to reach $10.10 billion by 2030, at a 13.6% CAGR, according to industry attribution market data. Adoption is also mainstream, with 75.5% of marketers preferring a multi-touch model, while 25.5% still rely on single-touch attribution according to Ruler Analytics' attribution statistics.
The objective isn't to force every platform to produce identical numbers. It's to create a trusted measurement layer that answers three separate questions:
What happened? The order system and canonical event pipeline answer this.
Which touchpoints were observable? Identity and event matching answer this.
What caused additional demand? Holdouts and lift tests answer this.
That separation prevents a platform's self-reported conversion total from becoming the agency's budget allocation strategy.
What Cross Platform Attribution Actually Means
Cross platform attribution is a shared measurement system for marketing journeys. It brings events from Meta, TikTok, Google, email, organic search, CRM records, and Shopify into a common structure, then applies consistent rules to the observable touchpoints before a conversion. The first job is reconciliation: establish which systems refer to the same customer and purchase before assigning credit.
Single-platform reporting remains each vendor's view of the journey. Meta measures events received from its placements and connected tracking systems. TikTok uses its own event stream, engagement signals, and reporting logic. Google Analytics 4 evaluates touchpoints inside its logged event stream, but cannot directly see impression or click activity from non-Google channels such as Meta, TikTok, podcasts, email, or offline media as described in this cross-channel attribution guide.
Single-touch attribution assigns the full conversion to one interaction, often the final click. Cross platform attribution reconstructs the available journey first, then applies a documented credit rule. That distinction matters when Meta creates demand, TikTok assists consideration, and Google captures the later search or branded click.
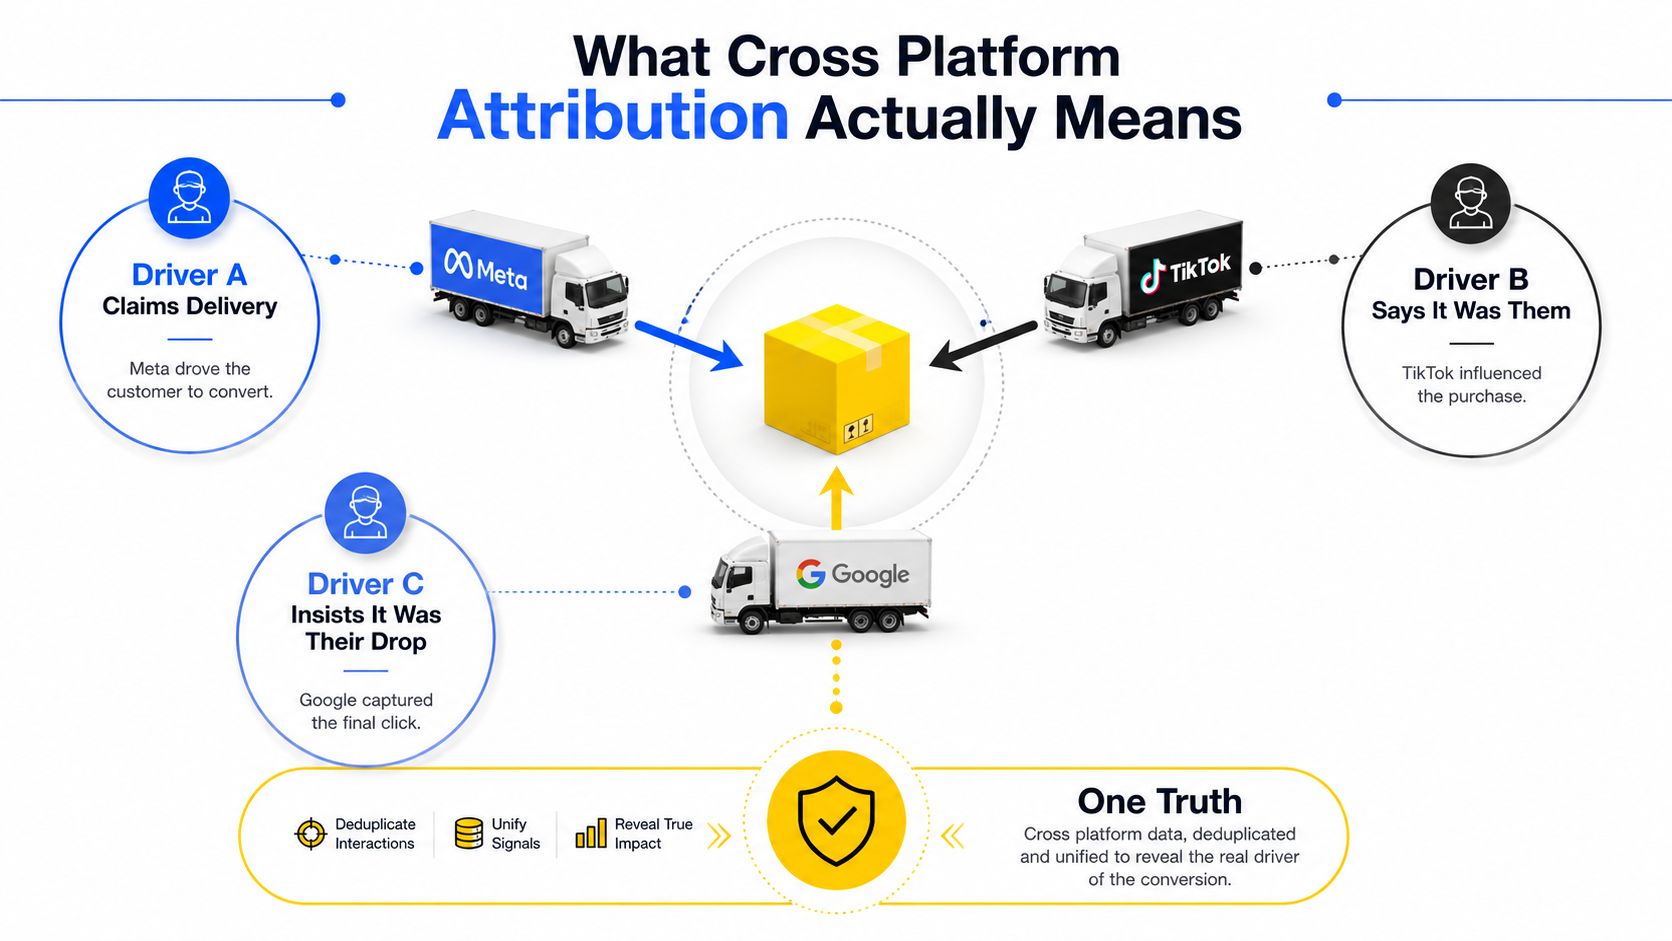
Three infrastructure controls separate a working setup from a collection of dashboards:
Deduplication ties one purchase to an order ID, event ID, or other canonical key, even when several platforms report it.
Identity resolution connects consented first-party activity across devices and logged-in sessions, rather than treating each browser as a different customer.
Consistent windows applies one documented click, view, and conversion policy instead of accepting every platform's default.
A unified system cannot recover touchpoints no platform observed. It can stop one purchase from appearing as several independent wins and expose where visibility is missing.
The technical foundation is a canonical event layer, not a vendor report. Each destination should receive normalized events such as , with agreed fields for order ID, customer ID where consent allows, value, currency, timestamp, channel, campaign, and consent status. Attribution sits above this layer. It cannot repair inconsistent event definitions, duplicated orders, or missing consent records.
Attribution Models and Their Trade Offs
No attribution model discovers objective truth on its own. Each model answers a different question, and each can mislead an omnipresent Meta, TikTok, and Google campaign when teams mistake assigned credit for causal impact.
How six models distribute credit
Last-click assigns all credit to the final eligible click before conversion. It's easy to explain and works for a short, direct-response funnel where the main question is what closed the sale. In omnipresent campaigns, it often overvalues branded search and undercounts discovery activity on Meta or TikTok.
First-click rewards the first recorded interaction. It helps evaluate acquisition and awareness entry points, but it can make the opening touch look more important than the channel that generated consideration, remarketing, or checkout completion.
Linear attribution splits credit evenly across every included touchpoint. This can provide a balanced view for longer buying journeys, yet equal credit doesn't mean equal influence. A fleeting impression and a high-intent product-page visit may receive the same share.
Time-decay gives more credit to recent interactions. It fits a short consideration cycle where the closing sequence matters most. The trade-off is that awareness activity receives less credit even when it created the demand that later search captured.
Position-based, or U-shaped, attribution gives 40% to the first touch, 40% to the last touch, and divides the remaining 20% among middle interactions. It recognizes discovery and closing while keeping the middle of the journey visible. The fixed weighting is still an assumption, not evidence that those positions caused the purchase.
Data-driven attribution uses modeled relationships to assign fractional credit. It can be useful when an advertiser has sufficiently consistent event data and a stable conversion volume. Its weakness is structural: a model can't assign meaningful credit to a platform or impression it never received, and each vendor's training data and definitions differ.
For B2B journeys with multiple stakeholders and longer sales cycles, this guide to marketing attribution models for B2B provides useful context on how model selection changes with funnel complexity.
Model | Credit Logic | Best Fit Scenario | Main Weakness |
|---|---|---|---|
Last-click | All credit goes to the final click | Measuring the closing interaction | Inflates branded search and ignores discovery |
First-click | All credit goes to the first touch | Evaluating acquisition entry points | Undervalues closing channels |
Linear | Credit is split evenly | Longer journeys with many touches | Assumes every touch matters equally |
Time-decay | Recent touches receive more credit | Short consideration cycles | Can punish awareness investment |
Position-based | 40% first, 40% last, remaining 20% across the middle | Funnels needing discovery and closing visibility | Uses fixed weights that may not reflect influence |
Data-driven | Fractional credit is modeled from available signals | Mature, consistent datasets | Inherits gaps and bias from the input data |
The practical approach is to use models as diagnostic lenses. Compare last-click with a broader rule-based model to identify channels that disappear when upper-funnel touches are excluded. Use data-driven output to study patterns, but validate budget decisions with experiments.
A model can organize observed evidence. It can't prove that an ad caused a purchase simply because the ad appeared in the path.
Implementation Approaches That Survive Signal Loss
The tracking method determines which journeys enter the attribution system. Browser pixels remain useful, but they should not be the only collection method for campaigns spanning Meta, TikTok, Google, mobile apps, CRM activity, and offline outcomes. Start by building one canonical event layer, then send the appropriate records to each platform.
Pixel collection
Browser pixels capture page views, lead events, purchases, and campaign parameters from the user's device. They are quick to deploy and integrate naturally with platform optimization. Their visibility drops when users opt out, browsers restrict storage, or the expected event fails to reach the platform.
Pixel data is therefore a platform signal, not a neutral source of truth. Keep it active where it supports delivery, then reconcile it with backend events in the canonical layer.
Server-side conversion capture
A server-side gateway receives confirmed events from the backend and forwards normalized records to the relevant platforms. Meta Conversions API, TikTok Events API, and Google Enhanced Conversions can receive stronger first-party signals than a browser-only setup.
Deduplication is the main implementation risk. If the browser pixel and server event represent the same purchase, both records need a shared event ID or order ID so the platform does not count two conversions. Engineering teams also need consent controls, retry logic, schema validation, and monitoring for delayed or malformed events.
The canonical event layer should preserve the backend record as the reconciliation reference. Platform feeds can support bidding and delivery, while the warehouse or independent measurement layer resolves discrepancies between reported and confirmed outcomes.
Identity stitching
A deterministic first-party ID, often based on a consented login or hashed email, can connect activity across devices and sessions. Probabilistic matching may extend coverage, but it introduces uncertainty and requires clear governance. Identity stitching cannot override consent choices, technically or lawfully, and it will not recover users who remain entirely anonymous.
Mobile measurement partners
For app-heavy businesses, a mobile measurement partner can centralize SDK events, network postbacks, and mobile attribution inputs. The trade-offs include SDK maintenance, integration effort, reporting latency, vendor dependence, and the work required to map mobile events to the same taxonomy used by the web and CRM.
Approach | Data Flow | Signal Resilience | Engineering Effort | Best Fit |
|---|---|---|---|---|
Browser pixels | Browser to ad platform or analytics tool | Limited by consent and browser controls | Low | Fast web activation and platform optimization |
Server-side events | Backend to gateway, then ad platforms | Stronger first-party event continuity | Medium to high | Web conversion capture and deduplication |
Identity stitching | Consent-based identifiers join sessions | Strong when users authenticate or identify themselves | High | Cross-device and customer-level journeys |
Mobile measurement partner | SDK and postbacks feed a measurement layer | Designed for fragmented mobile signals | Medium to high | App acquisition and re-engagement |
Hybrid stack | Canonical layer feeds web, mobile, CRM, and platforms | Highest practical resilience when governed well | High | Omnipresent campaigns with multiple surfaces |
A workable stack for most omnipresent campaigns combines one mobile measurement partner, a server-side web gateway, and one canonical event taxonomy. Platforms can optimize from their own feeds, while the warehouse or independent measurement layer controls reconciliation. Add incrementality tests to determine which reported outcomes represent additional demand, rather than treating platform paths as proof of causation.
Why Incrementality Beats Multi Touch in 2026
Multi-touch attribution can tell you which observable touchpoints appeared before a purchase. It doesn't reliably tell you whether the purchase would have happened without the spend.
That distinction matters more as identity signals disappear. A 2025 Gartner survey cited in industry coverage found that 71% of 400 CMOs lacked confidence in multi-touch attribution models, and 41% had abandoned them entirely, as reported in coverage of privacy-related attribution gaps. The same source describes a shift toward lift testing, server-side tracking, and probabilistic methods as more conversions become invisible to platform reporting.
Incrementality asks a causal question: what additional outcome did advertising create compared with a comparable group that didn't receive the advertising? A holdout design can be built around randomized users on the web, campaign-level exclusions in mobile environments, or geographic separation where user-level assignment isn't practical.
Designing a resilient lift test
Define the outcome first. Use a confirmed purchase, qualified lead, deposit, or another backend event. Don't use a platform's modeled conversion as the only success metric.
Create treatment and control. Randomize at the user level where the system permits it. For mobile, use a campaign holdout structure that keeps the excluded audience comparable.
Protect the test from contamination. Check whether control users can still receive the same campaign through another platform, audience, or retargeting pool.
Compare independent outcomes. Read platform-reported conversions alongside an MMP or warehouse-confirmed baseline. The disagreement itself helps reveal signal loss.
Use geo-lift when needed. Geographic tests can provide a fallback when deterministic user assignment isn't available, provided regions are selected and monitored carefully.
A test should cover enough of the purchase cycle to capture delayed conversions and repeat behavior. The exact duration depends on the business's buying cycle, but stopping before the journey completes creates a biased read.
For teams building their first experiment, this practical guide to designing a lift test is a useful reference for treatment design, control construction, and result interpretation.
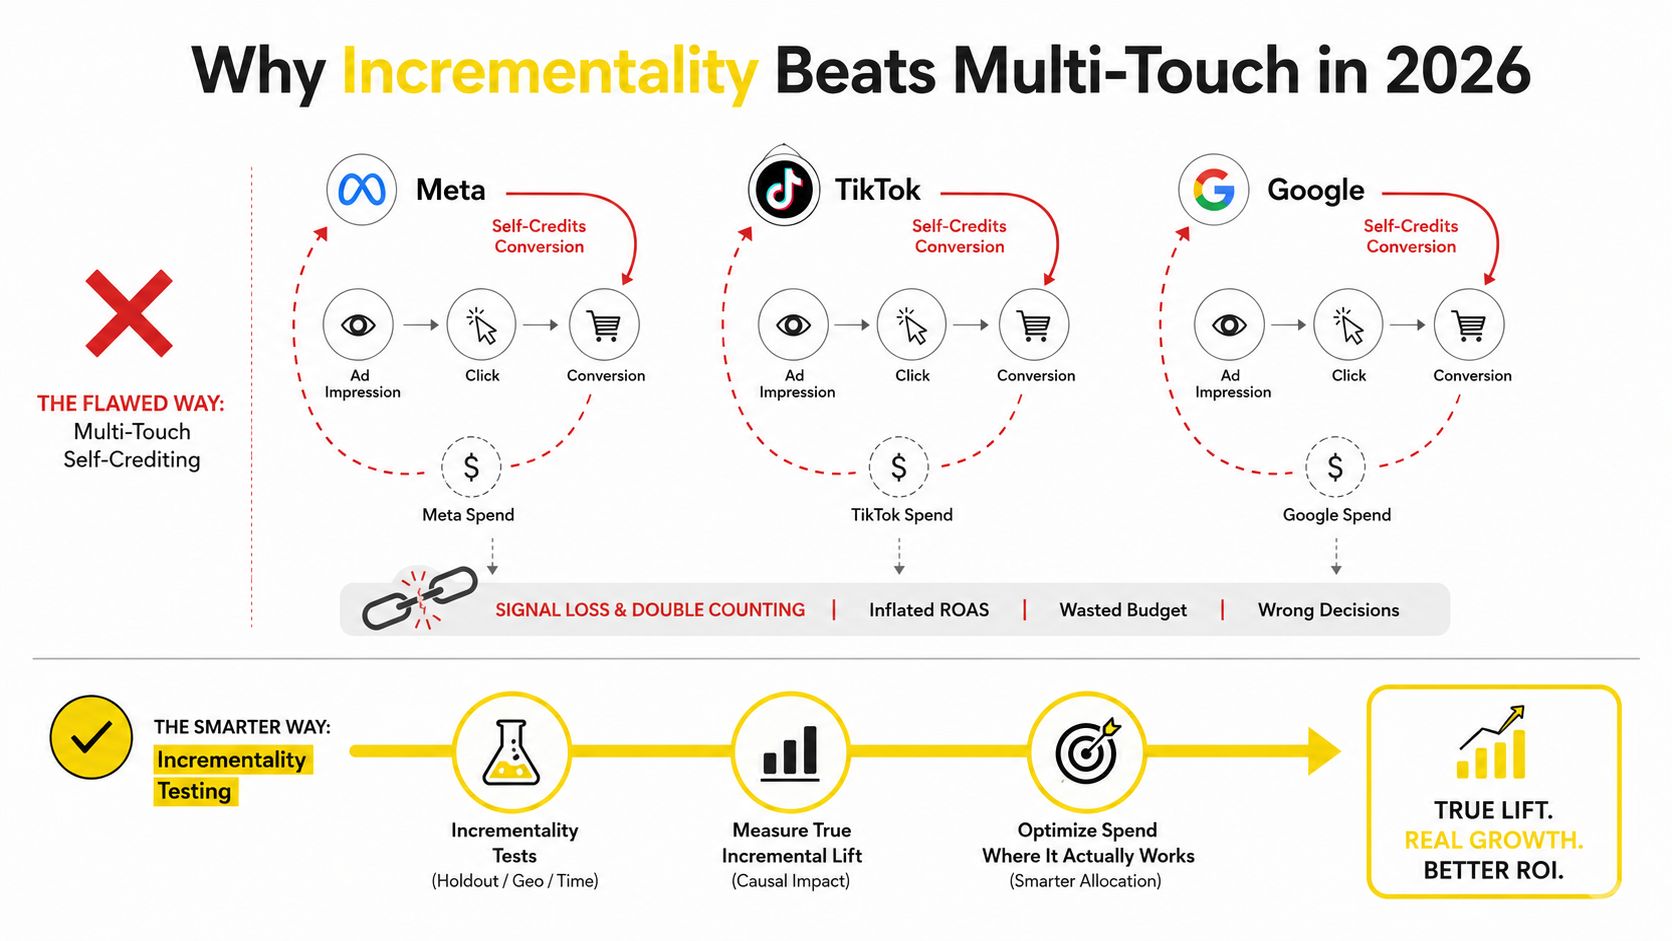
MTA allocates credit among visible touches. Incrementality estimates the revenue that would not have existed without the spend. Keep both if you need journey diagnostics, but let causal evidence carry more weight when reallocating budget.
Platform Specific Limitations You Need to Plan Around
Meta, TikTok, and Google do not define or report the same event in the same way. Their dashboards are built to optimize each platform's delivery system, not to function as a neutral cross-platform ledger. Reconciliation must happen in a shared event layer before performance comparisons can support budget decisions.
Meta may claim a conversion after a click or view within its configured reporting window. It can also receive activity from Instagram shopping tags, browser events, and Conversions API, each with different visibility and deduplication requirements. A redirect from an Instagram shopping surface can make Meta appear to be the final driver even when discovery began elsewhere.
TikTok reporting also combines click and view pathways. Its engagement metrics can pull attention toward profile visits, shares, and other on-platform actions. Those actions may support demand creation, but they are not equivalent to a confirmed purchase or CRM-qualified lead.
Google Analytics 4 data-driven attribution can model credit within the Google property network. It does not directly ingest every impression and click from Meta, TikTok, email, podcasts, or offline media. A user who first encounters the brand outside Google's observable event stream may later convert through organic search or a Google ad, leaving that earlier influence unrepresented.
Normalize before comparing
Do not choose the platform with the lowest or highest conversion count and call it the answer. Create a canonical taxonomy, then map each platform's native events to it:
Purchase: Confirmed by the backend and tied to an order ID.
Qualified lead: Defined by CRM status, not merely a form submission.
Checkout start: Captured consistently across web and app.
Marketing touch: Stored with channel, campaign, creative, timestamp, and consent state.
A platform's “purchase” event may represent a browser signal, an API event, a modeled conversion, or a view-through claim. Attach source labels to those records so analysts do not combine materially different signals into one total. The canonical layer should preserve the raw platform fields while exposing a normalized outcome for reporting and testing.
Platform | Default Window | Credit Bias | iOS/Safari Behavior | Workaround |
|---|---|---|---|---|
Meta | Account configuration varies | Can favor Meta click and view exposure | Browser visibility can fall when users restrict tracking | Reconcile pixel and Conversions API events with order IDs |
TikTok | Account configuration varies | Can favor TikTok engagement and eligible exposure | Signal loss can reduce deterministic matching | Use Events API, consistent event IDs, and backend confirmation |
Property and campaign configuration vary | Strongest for touchpoints visible within Google systems | Consent and browser limits affect available signals | Compare Google output with the canonical event layer |
Platform windows and API definitions also change. Meta removed 7-day view and 28-day view attribution windows from its Ads Insights API in January 2026, according to coverage of cross-platform measurement reconciliation. Teams that fail to monitor these changes can compare reports built under different rules without recognizing the mismatch. Keep platform reporting for diagnostics, then use reconciled outcomes and incrementality results for allocation decisions.
Best Practices for Tracking and Reporting at Scale
Treat measurement as a product with owners, documentation, release notes, and quality checks. A campaign can only be as reliable as the event definition that feeds it.
Start with one naming specification. Define event names, parameter keys, currency handling, order identifiers, lead stages, campaign naming, UTMs, and consent states before launch. Meta Conversions API, TikTok Events API, Google Enhanced Conversions, the CRM, and the warehouse should all map back to that same specification.
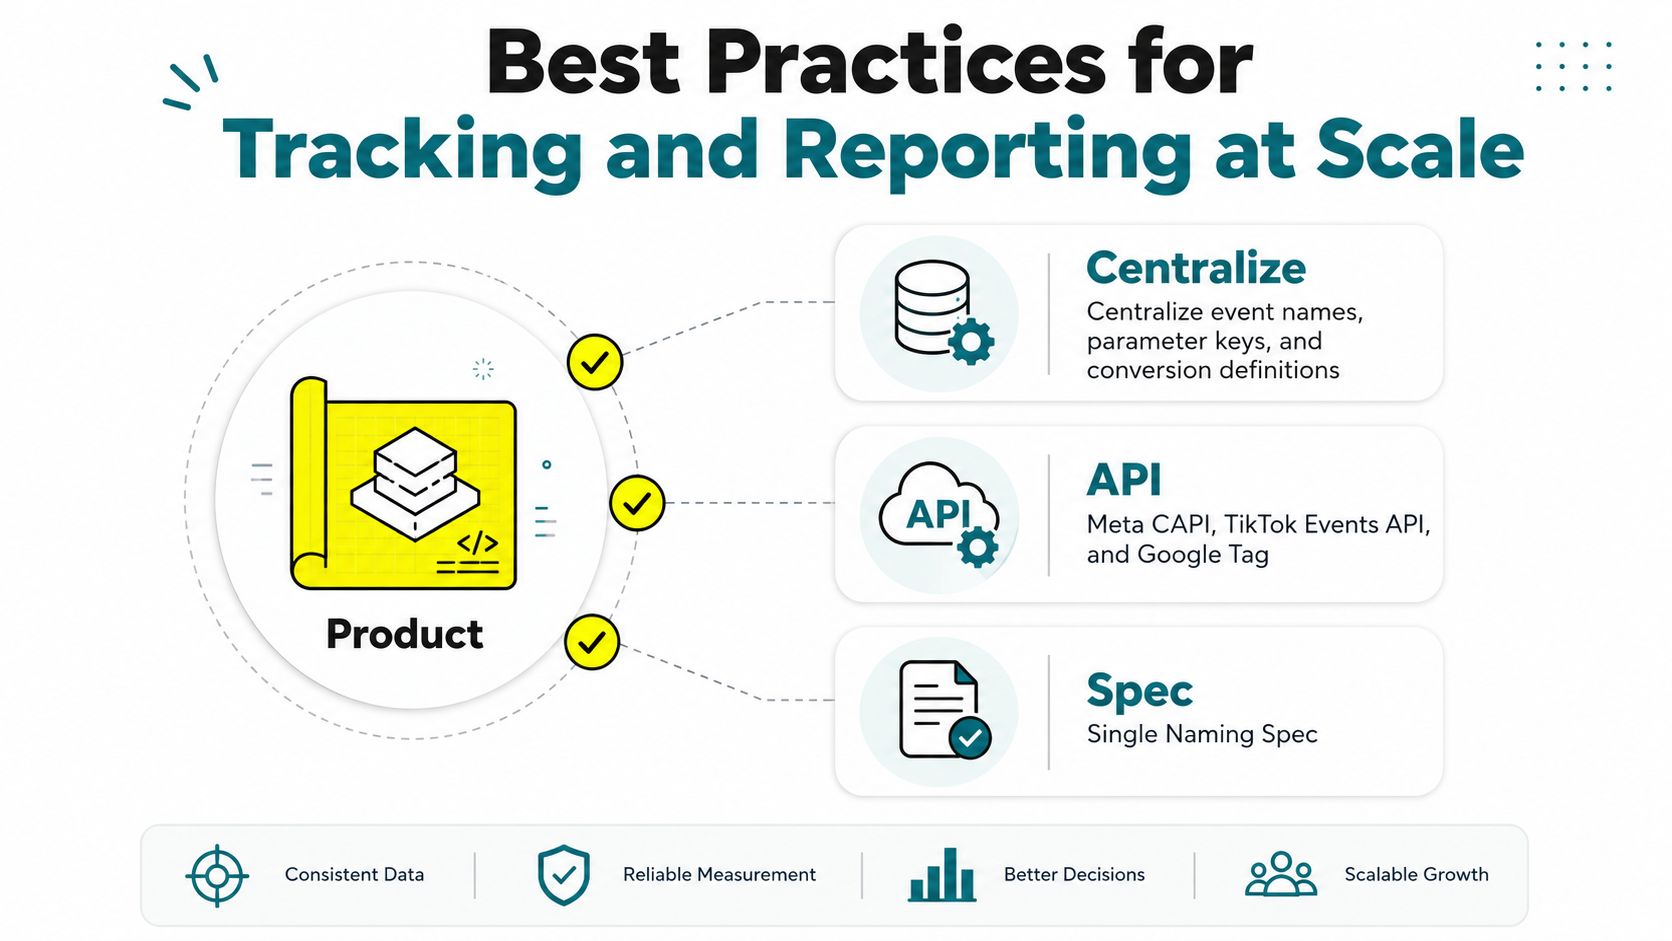
The operating checklist
Centralize definitions: Keep one versioned event dictionary and require approval for changes.
Capture confirmed outcomes: Send backend purchases and CRM-qualified leads into the canonical layer.
Deduplicate deliberately: Match browser and server events with stable event IDs or order IDs.
Govern UTMs at briefing: Campaign managers should add approved parameters before creative production and launch.
Reconcile regularly: Compare platform exports, the MMP where applicable, CRM outcomes, and warehouse totals on a fixed cadence.
Separate reporting views: Give executives a verified summary, buyers a channel diagnostic, and leadership an incrementality readout.
A nightly reconciliation job can flag material differences for human review, but the threshold must reflect the business's data volume and risk tolerance. Don't hide unexplained gaps inside a blended dashboard.
For teams that need a repeatable reporting workflow, a PostPulse reporting system can sit alongside the warehouse and platform exports, provided its definitions are mapped to the same canonical taxonomy.
Ownership matters: Rotate tracking QA between analytics and media buying. The people who deploy events and the people who spend against them should both be able to challenge the numbers.
Document the measurement SOP on one page. Include source-of-truth rules, event mappings, attribution windows, consent handling, reconciliation ownership, and the escalation path when a platform changes its API.
A Practical Roadmap for Agencies and Brands
Start with a 30-day audit. Export reported conversions from Meta, TikTok, and Google, then compare them with the warehouse, Shopify, CRM, or other commercial source of truth. Quantify the disagreement in revenue terms, identify duplicate order IDs, and list every conversion definition that doesn't match.
Use those findings to choose the next investment. A mobile-first business may need an MMP. A web-led brand may need a server-side gateway and warehouse event layer. A business with complex lead qualification needs CRM-to-revenue joins before it changes media allocation.
During the next implementation phase, route Meta Conversions API, TikTok Events API, and Google Enhanced Conversions through the canonical event layer. Retire redundant tracking paths that produce duplicate claims, then run a baseline incrementality test for each major channel before moving meaningful budget.
After the measurement layer stabilizes, establish a recurring holdout calendar and train planners to interpret lift results alongside attribution reports. Agency and brand KPIs should move away from platform-reported ROAS alone and toward verified incremental revenue, qualified pipeline, and contribution margin.
Attribution isn't a dashboard you install once. It's infrastructure you fund, version, monitor, and review as platforms change. The teams that reconcile first and test causality second make better allocation decisions than teams that choose the most flattering platform report.
Wojo Media helps brands connect omnipresent paid campaigns across Meta, TikTok, Google, and YouTube with disciplined UTMs, server-side tracking, platform integrations, and CRM revenue signals. Visit Wojo Media to discuss a measurement and growth system built around verified outcomes rather than fragmented dashboard claims.
Comments