.png)
Paid Search KPIs That Actually Drive Profitable Growth

You open Google Ads, see a healthy click-through rate, and think the campaign is fine. Then leads come in weak, sales closes stall, or revenue doesn't justify spend. That moment trips up a lot of smart marketers because paid search rarely breaks in just one place.
A keyword can earn clicks but attract the wrong person. An ad can look relevant but hand traffic to a weak landing page. A campaign can hit a CPA target while still bringing in low-quality leads that sales never closes. If you read each number by itself, the account can look better than the business feels.
That's why I teach paid search KPIs as a diagnostic chain, not a scoreboard. Start with impression quality. Move to click quality. Then post-click conversion. Then qualification. Then customer value and profit. Once you think in that order, the metrics stop fighting each other and start telling a story.
Why Paid Search KPIs Mislead Without a System
At 9 a.m., the dashboard looks calm. CTR is up. Spend is pacing. Nothing appears broken. By 3 p.m., sales is asking why the leads are weak and the client is asking why revenue is lagging.
That disconnect is normal in paid search because the account can look healthy at the top while the business struggles further down. A campaign can win attention without winning qualified demand. It can generate leads without generating customers. It can even hit a target CPA while still wasting money if the wrong people are converting.
The mistake is treating each KPI like a final verdict.
A better way to read the account is to treat KPIs like checkpoints in a relay race. Each one only tells you whether the handoff to the next stage worked. If one handoff is weak, the later metrics get distorted.
Good surface metrics often describe activity, not business quality
CTR is a good example. It measures whether your ad earned the click. It does not confirm that the searcher had the right intent, that the landing page matched the promise, or that the lead was worth your sales team's time.
That distinction matters. A high CTR can come from broad curiosity, weak qualification, or ad copy that promises more than the page delivers. In all three cases, the click count rises while business value stays flat.
The same logic applies across the chain:
Impressions show whether you entered enough relevant auctions.
Clicks show whether the message earned attention from those searchers.
Conversions show whether the visit turned into an action.
Qualified leads or customers show whether that action had commercial value.
Read in order, those metrics help you find the break point. Read in isolation, they create false confidence.
Isolated KPIs push teams toward the wrong fix
New strategists often react to the first number that looks off. Low CTR leads to ad copy tests. Low conversion rate leads to landing page edits. High CPA leads to bid cuts.
Sometimes those actions are right. Often they are early.
If CTR is strong but qualified lead rate is weak, writing more clickable ads can make the problem worse by pulling in even more unqualified traffic. If conversion rate is healthy but cost per customer is poor, the issue may sit upstream in keyword intent or downstream in lead quality. If impression share is low, budget may be the constraint, but poor ad rank can produce the same symptom.
The KPI is the smoke. Your job is to find the fire.
A strategist's job is diagnosis
A new strategist usually starts with a fair question: what counts as a good CTR or CVR? Benchmarks can help set expectations, but they cannot tell you whether your campaign is built correctly for your sales model, price point, or lead qualification standard.
What matters more is the relationship between metrics.
A rising CTR with flat conversion rate can signal that the ad is broadening appeal faster than the landing page is filtering intent. A solid CPA with poor close rate can signal that the platform is finding cheap conversions, not good prospects. A lower ROAS campaign can still be the better investment if it produces higher qualification rates, stronger close rates, and more profitable customers.
That is why paid search KPIs need a system. They work best as a diagnostic chain that starts with impression quality and ends with profit. Once you read them that way, you stop chasing the prettiest number in the platform and start fixing the step that limits growth.
How Paid Search KPIs Fit Together From Click to Customer
Think of a search campaign like a pipe system. Traffic enters at the top. Revenue comes out at the bottom. Every leak in the system changes the economics downstream.
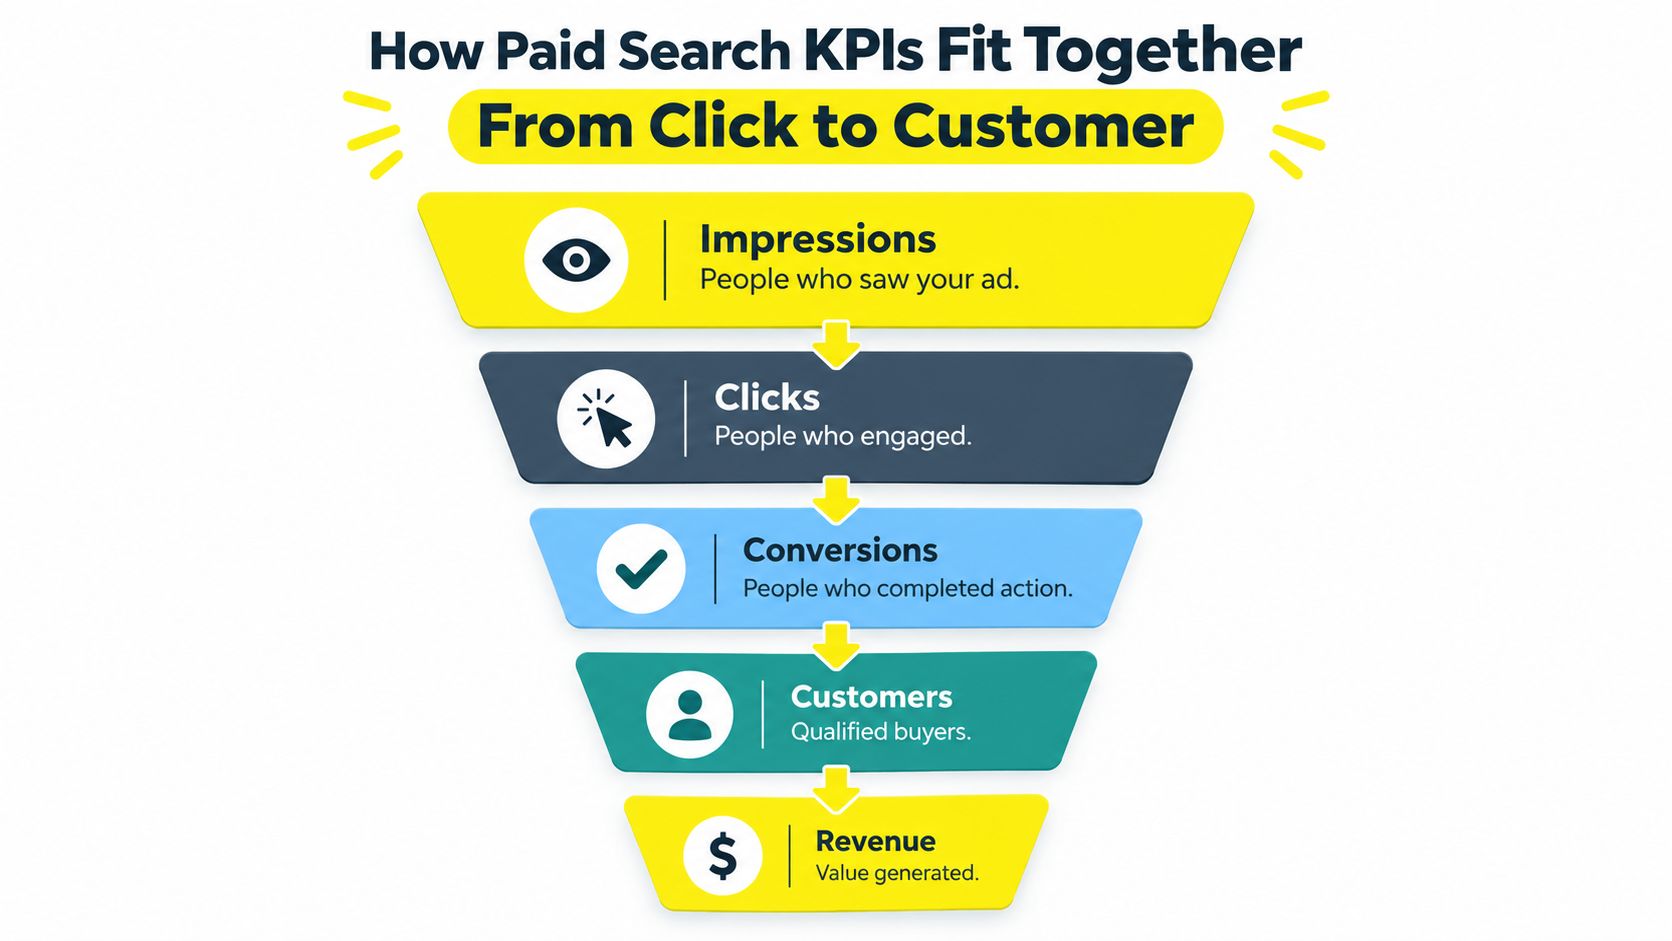
The five stages that matter
At the top, you have impressions. This is market exposure. Your ad had a chance to be seen. In today's search environment, that matters more than many teams admit because visibility can stay high even when click behavior changes.
Next come clicks. That's where CTR lives. CTR reflects how well your keyword, ad copy, and user intent line up. It's an engagement signal, not a profit signal.
Then you get conversions. The landing page, offer, form friction, trust signals, and mobile experience start doing the heavy lifting. A click is just interest. A conversion is action.
After that, mature teams look at customers or qualified opportunities, not just leads. If you work in lead gen, this layer is where a lot of paid search reporting falls apart. A cheap lead can still be expensive if the pipeline rejects it. If your team needs a strong framework for that handoff, this piece on WaveGen.ai on generating leads is useful because it connects lead capture to actual lead quality and follow-up thinking.
At the bottom is revenue or profit. ROAS, margin, repeat purchase behavior, and customer value matter.
Why order matters
If you troubleshoot backward, you waste time.
For example, if CPA rises, many advertisers jump straight to bidding or budget. But CPA is just the result of what happened earlier. Ask these questions in sequence:
Was traffic quality solid? Look at search terms, audience segment, and impression quality.
Did the ad earn the click for the right reason? Look at CTR and message alignment.
Did the page convert that intent? Look at conversion rate.
Did the conversion create business value? Look at qualification rate, sales acceptance, and cost per customer.
A paid search account doesn't fail in one number. It fails in a chain.
Put every KPI into one of three buckets
When you meet a new metric, sort it fast:
Efficiency metrics CTR, CPC, conversion rate, CPA, ROAS. These show how efficiently spend turns into actions.
Diagnostic metrics Quality Score, Impression Share, lost impression share due to budget or rank. These explain why performance may be happening.
Business metrics Qualification rate, cost per opportunity, cost per customer, revenue quality. These tell you whether the campaign helped the company, not just the ad account.
That sorting habit saves a lot of confusion. It stops you from expecting ROAS to explain ad relevance, or expecting CTR to explain pipeline quality.
Core Efficiency Metrics Every Search Campaign Needs
A new strategist opens the dashboard and sees five numbers fighting for attention. CTR looks healthy. CPC climbed. Conversion rate slipped. CPA jumped. ROAS still looks acceptable.
Which number deserves attention first?
The answer gets clearer when you read these metrics as a chain instead of a scoreboard. Each one describes a different handoff in the path from search impression to profit. If you isolate them, you can celebrate the wrong win. If you connect them, you can spot where efficiency broke.
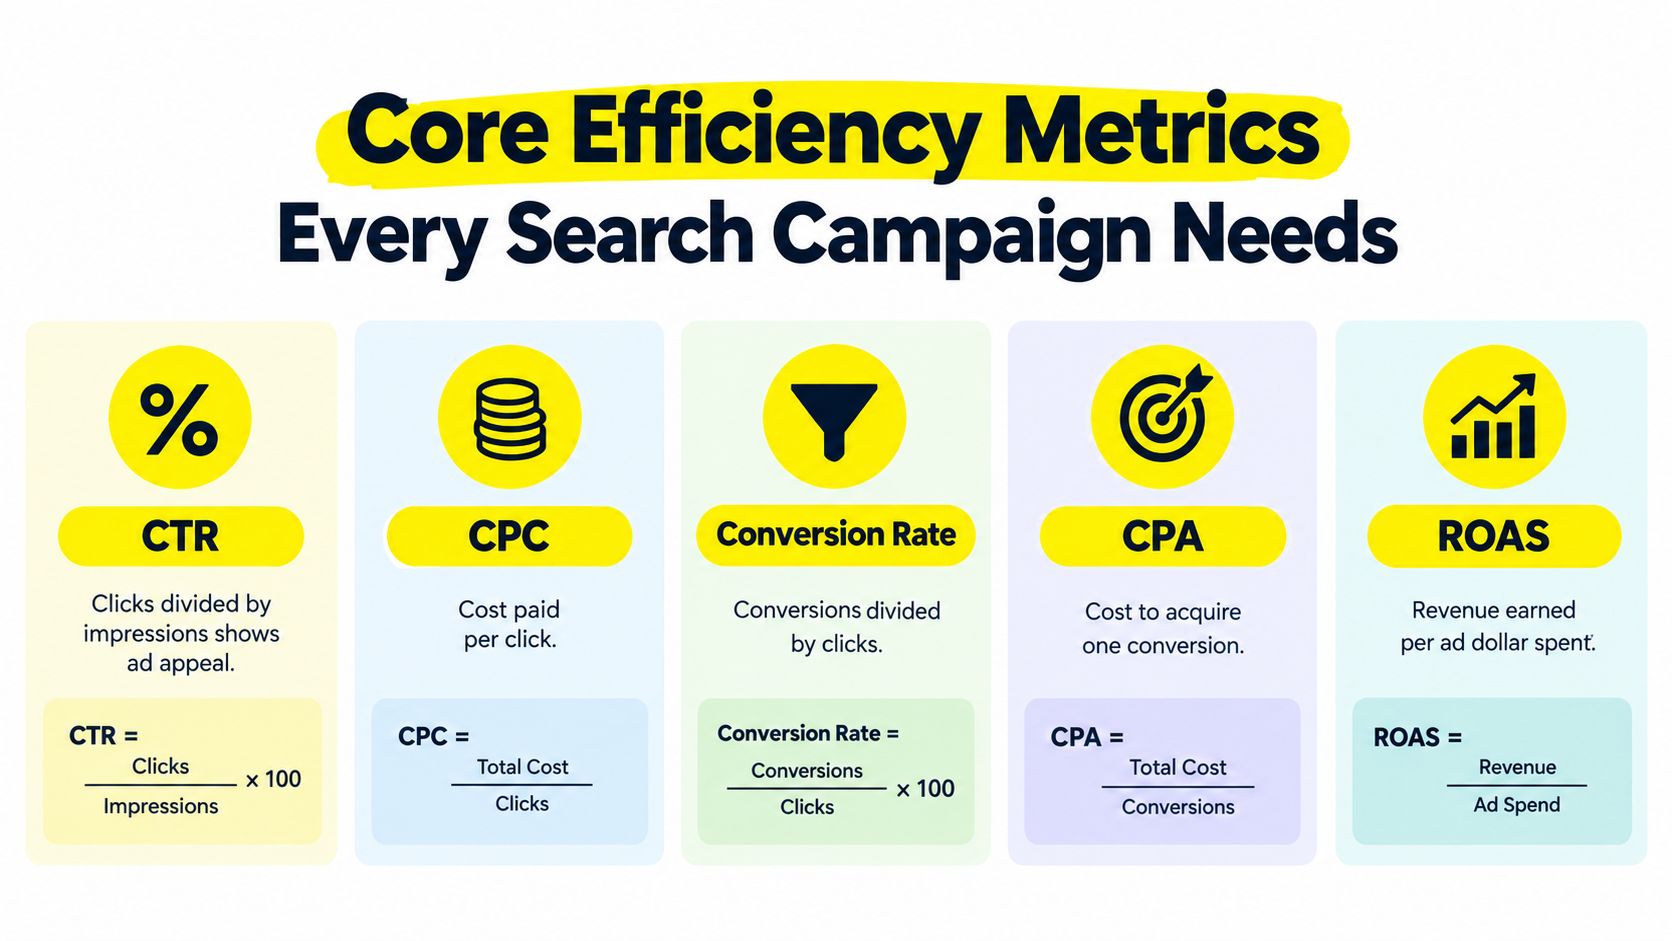
CTR tells you whether the impression earned the click
Click-through rate (CTR) = Clicks / Impressions
CTR is your first efficiency checkpoint. It measures how often a searcher chose your ad after seeing it. In practice, it helps answer a simple question: Did this impression look relevant enough to deserve a visit?
A strong CTR usually points to good query-to-ad alignment. The keyword matched the search. The headline reflected intent. The offer felt timely enough to click.
But CTR has limits. Curiosity clicks can inflate it. Broad match traffic can inflate it. Ad copy that sounds attractive to the wrong person can inflate it too.
Treat CTR like the front door opening, not proof of a good sale. If more people walk in but fewer become qualified leads or customers, higher CTR did not improve the account.
CPC tells you what access to that click cost
Cost per click (CPC) = Spend / Clicks
CPC is the price of getting the visit. Auction competition affects it, but so does relevance. Two advertisers can bid on similar searches and pay different amounts because one has better ad relevance and expected click performance.
That is why CPC should never be judged in a vacuum. A higher CPC can be acceptable if the traffic is better qualified and converts into customers at a stronger rate. A low CPC can still be expensive if it buys low-intent clicks that never turn into revenue.
A simple way to teach this to a junior buyer is this: CTR measures whether the ad got invited into the conversation. CPC measures what that invitation cost.
Conversion rate shows whether the click became action
Conversion rate (CVR) = Conversions / Clicks
CVR measures what happened after the visit began. Landing page clarity, message match, page speed, trust signals, form friction, and offer strength start showing up in the numbers.
If CTR is healthy but CVR is weak, the ad may be attracting the wrong intent, or the landing page may be failing to continue the conversation the ad started. That distinction matters. One problem lives in targeting or messaging. The other lives in the post-click experience.
This short explainer can help newer teams align metric definitions across client reporting: guide to ad metrics for agencies.
To make the formulas easier to see in action, this walkthrough is worth watching:
CPA combines click cost and conversion efficiency
Cost per acquisition (CPA) = Spend / Conversions
CPA is where earlier metrics meet. It is the result of what you paid for traffic and how well that traffic converted.
That makes CPA useful, but also easy to misuse.
If CPA rises, the fix is not automatically a bid cut. Sometimes CPC increased because competition changed. Sometimes CVR dropped because the landing page broke, the form got longer, or search term quality drifted. Sometimes both happened at once. CPA only shows the symptom. You still need to locate the cause upstream.
A quick math example helps. If clicks get 20% more expensive and conversion rate stays flat, CPA rises. If CPC holds steady but CVR drops, CPA also rises. Same outcome. Different fix.
ROAS is helpful, but surface efficiency can hide weak lead quality
Return on ad spend (ROAS) = Revenue from ads / Ad spend
ROAS is useful when revenue tracking is accurate and closely tied to the click. That is why ecommerce teams often rely on it more heavily than lead generation teams.
For search programs with offline sales cycles, ROAS can flatter campaigns that generate volume without generating strong customers. A campaign can report acceptable revenue on paper while sending low-fit leads to sales, slowing close rates, or producing customers with weak margin.
That is why mature search teams keep one eye beyond ROAS. Qualification rate, cost per qualified lead, cost per opportunity, and cost per customer often tell the business story more clearly. If ROAS looks fine but cost per customer worsens, the account is becoming less efficient where it counts.
The practical reading order looks like this. CTR asks whether the impression earned interest. CPC asks what that visit cost. CVR asks whether the visit became action. CPA asks what each action cost. ROAS asks whether tracked revenue justified the spend. Then business metrics answer the question that matters most: whether those conversions turned into profitable customers.
Quality Score and Impression Share as Diagnostic Signals
Efficiency metrics tell you what happened. Diagnostic metrics help explain why.
That's where Quality Score and Impression Share matter. They shouldn't replace business metrics, but they can stop you from making the wrong fix.
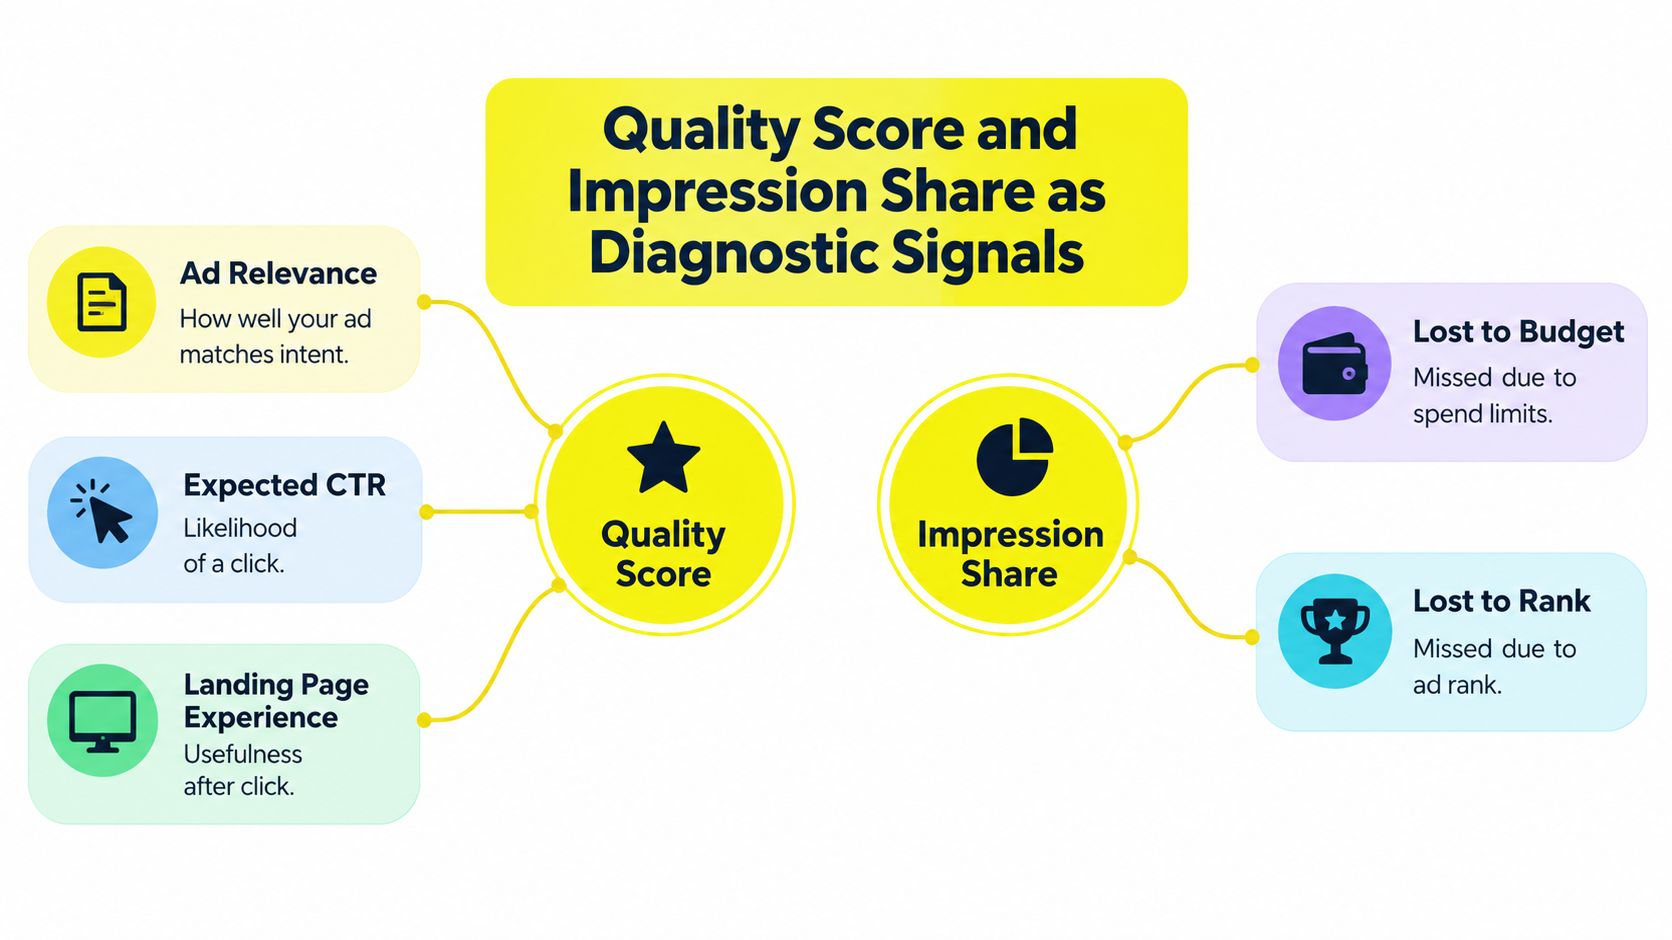
Quality Score is really three signals wearing one label
Google's historical reporting update matters here because it changed Quality Score from a snapshot into a trend. Since May 15, 2017, advertisers have been able to view historical Quality Score data for keywords, with available history going back to January 22, 2016, through four historical columns: Quality Score (hist.), Landing page experience (hist.), Ad relevance (hist.), and Expected CTR (hist.), according to Google Ads historical reporting details.
That matters because Quality Score is built from three component ideas:
Ad relevance Does the ad match the query well enough?
Landing page experience Does the page deliver on the promise and make the visit useful?
Expected CTR Is the ad likely to earn clicks compared with other results?
This is one of the clearest examples of why paid search KPIs should be read as a system. One keyword score can reflect creative quality, page quality, and intent alignment all at once.
Historical trends beat snapshots
A single low score doesn't tell you much. A declining trend does.
If ad relevance falls over time, check search terms, keyword grouping, and copy drift. If landing page experience drops while CTR stays stable, the ad may still be attracting the right person but sending them to a page that no longer matches expectations. Historical columns make that pattern easier to see across reporting periods.
The real value of Quality Score isn't the label. It's the direction over time.
Impression Share is your auction coverage signal
Impression Share answers a different question: How often did you show up when you were eligible to show?
That turns it into a visibility metric. If you're losing share, the cause usually falls into one of two buckets:
Lost to budget Your daily or campaign-level budget is capping participation.
Lost to rank Your bids, relevance, or overall competitiveness aren't strong enough to win more auctions.
Newer search behavior complicates the old advice to ignore impressions. Recent guidance points out that impressions can function as a real SERP coverage signal in a zero-click environment. Recent 2026 reporting cited in Incremys on Google paid search notes AI Overviews appearing in roughly 48% of tracked queries and in 25.11% of 21.9 million searches, which means click-based KPIs can soften even when visibility stays strong.
So if CTR weakens while impression presence remains healthy, don't assume demand disappeared. Sometimes the search results page changed first.
From CPA and ROAS to Real Business Profit
A campaign can post a healthy CPA on Monday and still miss the revenue goal by Friday.
That happens when reporting stops at the platform conversion and never asks what happened after the click became a lead. A search strategist has to read KPIs like a diagnostic chain, not a scoreboard. CTR tells you whether the right people are entering the funnel. Quality Score affects what you pay to reach them. Conversion rate tells you whether the page and offer turned that traffic into action. Profit shows whether those actions became customers worth buying.
Averages hide expensive mistakes
Cross-industry benchmarks can give you rough context, but blended account averages often hide the problem you need to fix.
A branded campaign can pull CPA down for the whole account while non-branded acquisition stays unprofitable. Warm audiences can make conversion rate look strong while cold traffic is struggling. Lead forms can flood the dashboard with low-cost conversions while the sales team rejects half of them. It is the same problem as grading a class by one average score when one student aced the quiz and failed the final. The average looks stable. The underlying performance does not.
Use this table as a quick filter before you call performance good or bad.
How Segmentation Changes What Good Looks Like
Segment | Typical KPI Signal | Interpretation Risk |
|---|---|---|
Branded search | Higher intent, often cleaner conversion behavior | Can make the whole account look healthier than non-branded acquisition really is |
Non-branded search | More discovery, usually tougher economics | Can look inefficient early even when it drives net-new demand |
Cold audiences | Weaker engagement and lower immediate intent | Can be cut too quickly if judged by bottom-funnel standards |
Warm audiences | Better action rates and stronger familiarity | Can inflate performance if mixed into prospecting reports |
Lead campaigns | More volume, delayed revenue clarity | Can make CPA look strong while sales quality stays weak |
Purchase campaigns | Cleaner revenue tie-back | Can hide upper-funnel contribution if viewed alone |
When ROAS helps, and when it distracts
ROAS is useful when revenue tracking is trustworthy and purchase values are captured correctly.
But ROAS gets shaky in lead generation, long sales cycles, or any account where the first conversion is only a hand-raise. In those cases, a strong ROAS or low CPA can reward the wrong behavior. The platform may be finding people who fill out forms cheaply, while the business needs people who qualify, book, close, and stay.
That is why many teams should rank business outcome metrics above surface efficiency metrics. Qualification rate, cost per opportunity, and cost per customer usually tell you more than a cheap lead does. A lower CPA is only an improvement if the customer it buys is still profitable.
A better chain for profit-minded teams
Read performance in sequence:
Did the click turn into a conversion?
Did that conversion qualify?
Did it become a real opportunity?
Did it become a customer?
Did the margin justify the acquisition cost?
Each step acts like a filter.
If CTR is high but qualification rate is weak, the ad may be attracting interest without enough intent. If conversion rate is strong but cost per customer is poor, the landing page may be doing its job while the offer is drawing low-fit leads. If ROAS looks healthy but repeat purchase rate or margin is thin, revenue is being counted correctly while profit is still under pressure.
That is the shift from campaign math to business math. A conversion is an event. Profit is the outcome.
How to Act on Each KPI Without Chasing Vanity Gains
When a KPI moves, don't ask “How do I improve this number?” Ask, “What is this number reacting to?”
That small shift keeps you from making cosmetic changes that increase activity but hurt economics.
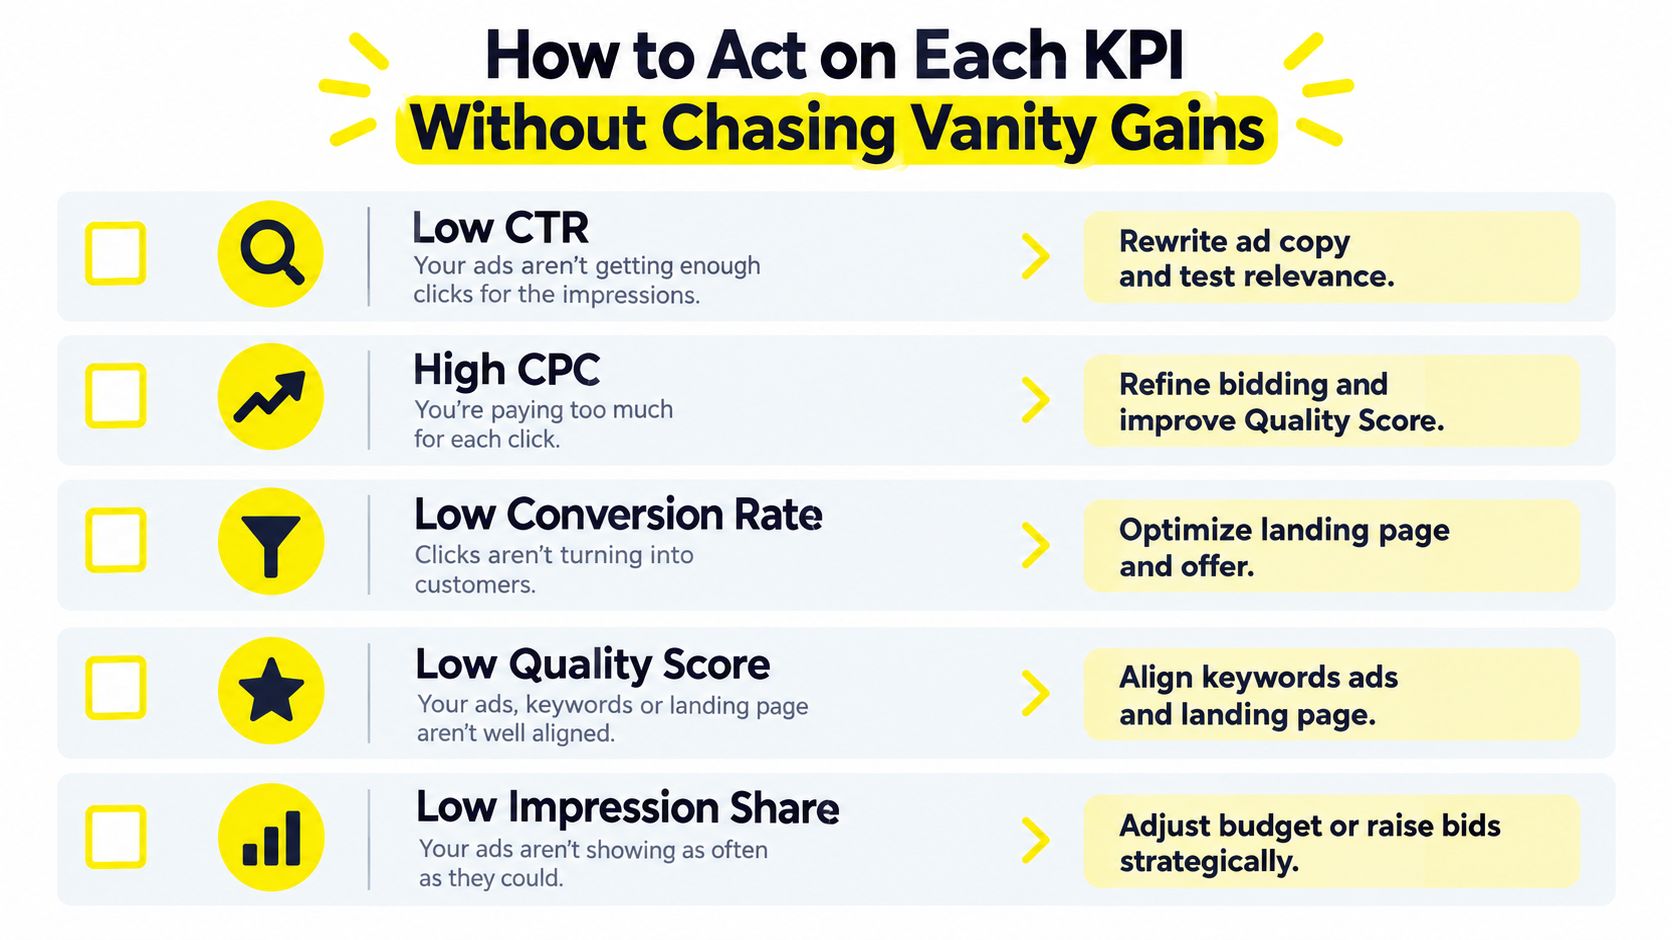
Start with the most likely root cause
Use this sequence when you review paid search KPIs:
Low CTR Check query-to-ad alignment first. Rewrite headlines around actual search intent, tighten keyword grouping, and review search terms for mismatch. Don't chase curiosity clicks with vague promises.
High CPC Look at auction pressure, but also review relevance. Better alignment between keyword, ad, and landing page can help before you raise bids.
Low conversion rate Audit the landing page before you touch bidding. Tighten message match, reduce friction, clarify the offer, and make sure the page answers the query that triggered the ad.
Low Quality Score Break it into components. Fixing landing page experience is a different job than fixing expected CTR.
Low Impression Share Decide whether the limit is budget or rank. Budget problems need spend decisions. Rank problems need competitiveness decisions.
Don't let one improved metric distract you from the chain
A lot of vanity optimization starts with good intentions.
An advertiser sees low CTR, writes more aggressive copy, and gets more clicks. But the clicks are less qualified, conversion rate falls, and CPA gets worse. The CTR “win” becomes a business loss.
That's why reporting tools matter. If you're managing multiple campaigns or clients, a centralized view helps you spot whether changes in CTR are helping downstream metrics or just creating noise. Teams that need that kind of rollup often use internal dashboards or tools to centralize client data with ClipCreator.ai. Wojo Media also describes tracking backend paid media signals such as CPA, ROAS, lead quality, conversion value, and trend-level account diagnostics as part of campaign management.
Fix the earliest broken link in the chain. That usually creates the cleanest downstream improvement.
A simple weekly decision tree
If you want one practical review rhythm, use this:
Check visibility Are you showing often enough for the searches you care about?
Check click quality Is the ad earning clicks from the right queries?
Check post-click action Is the page converting the traffic you paid for?
Check business quality Are those conversions qualified, accepted, and closed?
Only then scale More budget rarely fixes weak intent, weak messaging, or weak offer fit.
That sequence keeps you grounded. It also makes conversations with sales, clients, and founders much clearer because you can point to the actual bottleneck instead of defending one metric in isolation.
Your Next Steps to Turn KPIs Into Predictable Growth
The most useful way to manage paid search KPIs is to stop treating them like separate grades. They're connected signals in a chain that runs from impression quality to profit.
Three habits make the biggest difference.
Track trends, not snapshots
One day of data can mislead you. Trend lines show whether relevance is improving, whether page performance is slipping, and whether auction pressure is changing.
Segment before you judge
Don't blend branded and non-branded traffic. Don't grade cold traffic like warm traffic. Don't treat every form fill like a customer. Segmentation turns “average” reporting into decision-ready reporting.
Optimize for business outcomes
CTR, CPC, and conversion rate matter because they shape economics. But the campaign only wins when those economics produce qualified demand and profitable customers.
One more adjustment matters now. As search results change, impressions deserve more respect than they used to get. In a world with more zero-click behavior and AI-generated SERP features, visibility can hold while clicks soften. That doesn't mean impressions replace conversion metrics. It means your diagnostic chain needs to account for SERP reality, not just old reporting habits.
A clean weekly checklist looks like this:
Review search term quality
Check CTR for message fit
Check CPC for auction efficiency
Check conversion rate for landing page performance
Check qualification rate or customer creation
Judge CPA and ROAS only after the steps above
Use impressions and share metrics to understand visibility shifts
If you remember one thing, make it this. The right KPI to watch first depends on where the chain is breaking, not on which number is easiest to improve.
If you want help turning paid search reporting into an actual growth system, Wojo Media builds campaigns around the full chain, from offer and landing page conversion to backend KPI tracking and scaling decisions. If that's the gap in your account right now, visit Wojo Media and see how they approach profitable paid traffic with business metrics, not just platform metrics.
Comments