.png)
Google Ads Reporting: Setup, KPIs, and Fixes

You can spend an hour inside Google Ads, sort columns a few different ways, and still miss the reason a campaign is winning or bleeding. That usually shows up later in GA4, CRM, or finance, where the numbers don't line up and everyone starts arguing about which report is “right.” Google Ads reporting is only useful when it helps you reconcile those gaps fast enough to make a better budget decision.
The platform itself is too large to treat casually. Google Ads holds 91% global market share among businesses using search engine advertising, reaches roughly 4.77 billion internet users worldwide, and generated about $264.5 billion in ad revenue in 2024, up from $237.86 billion in 2023, according to a 2026 industry statistics roundup Searchlab's 2026 Google Ads statistics roundup. With that kind of scale, a sloppy reporting habit doesn't just create confusion, it can push real money into the wrong pockets.
Why Default Google Ads Reporting Falls Short
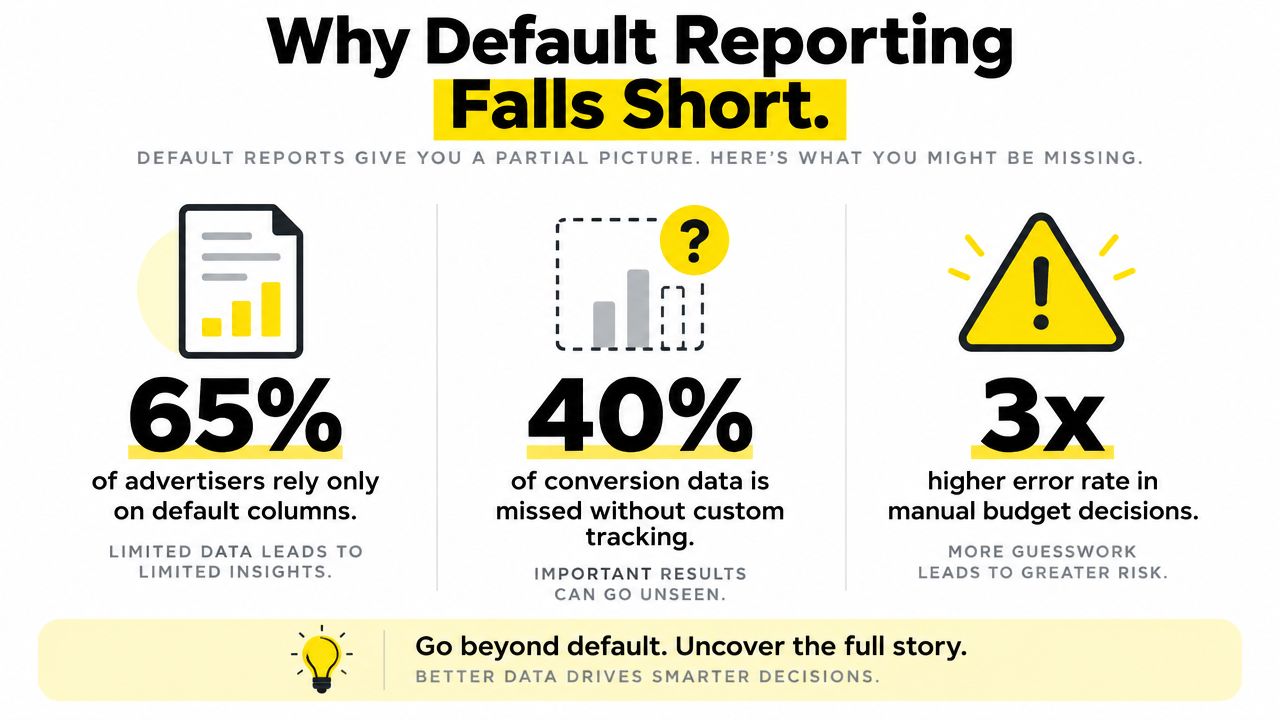
A campaign can show an attractive cost per conversion in Google Ads while the CRM records weak leads, delayed sales, or no revenue. The discrepancy usually appears after the click, when attribution rules, conversion delays, duplicate events, and lead-quality filters separate the platform view from business reality. Default reporting is built for fast monitoring, not for explaining those gaps.
Custom and preset reporting windows have been part of the workflow since the 2010 Google's AdWords Reporting Guide. That historical record does not describe today's interface, but the underlying discipline still applies. Compare the exact period before and after a creative change, promotion, or budget shift instead of relying on a broad calendar view.
Practical rule: if a report cannot isolate the period you changed, it cannot establish whether the change worked.
What the default view hides
The standard campaign table compresses differences that affect profitability. Attribution timing can shift conversions into another reporting period. Placement and network details can conceal weak inventory. Reported conversion value can also look healthier than the CRM once duplicate submissions, unqualified leads, refunds, or offline sales outcomes are reconciled.
That problem becomes harder in campaigns spanning Search, YouTube, and remarketing, where several touchpoints influence one buyer. Google Ads may claim the conversion, while GA4 assigns a different source or the CRM rejects the lead entirely.
The answer is not another dashboard by itself. Build a routine that asks what changed, where it changed, when the conversion was recorded, and whether GA4 and the CRM agree. Use the interface to locate signals, then reconcile those signals against backend outcomes before changing bids or budgets.
Configuring Custom Columns and Date Ranges
Good reporting starts with the table itself. If the visible columns do not match the decisions you need to make, every export turns into cleanup work, and every review turns into a debate about definitions.
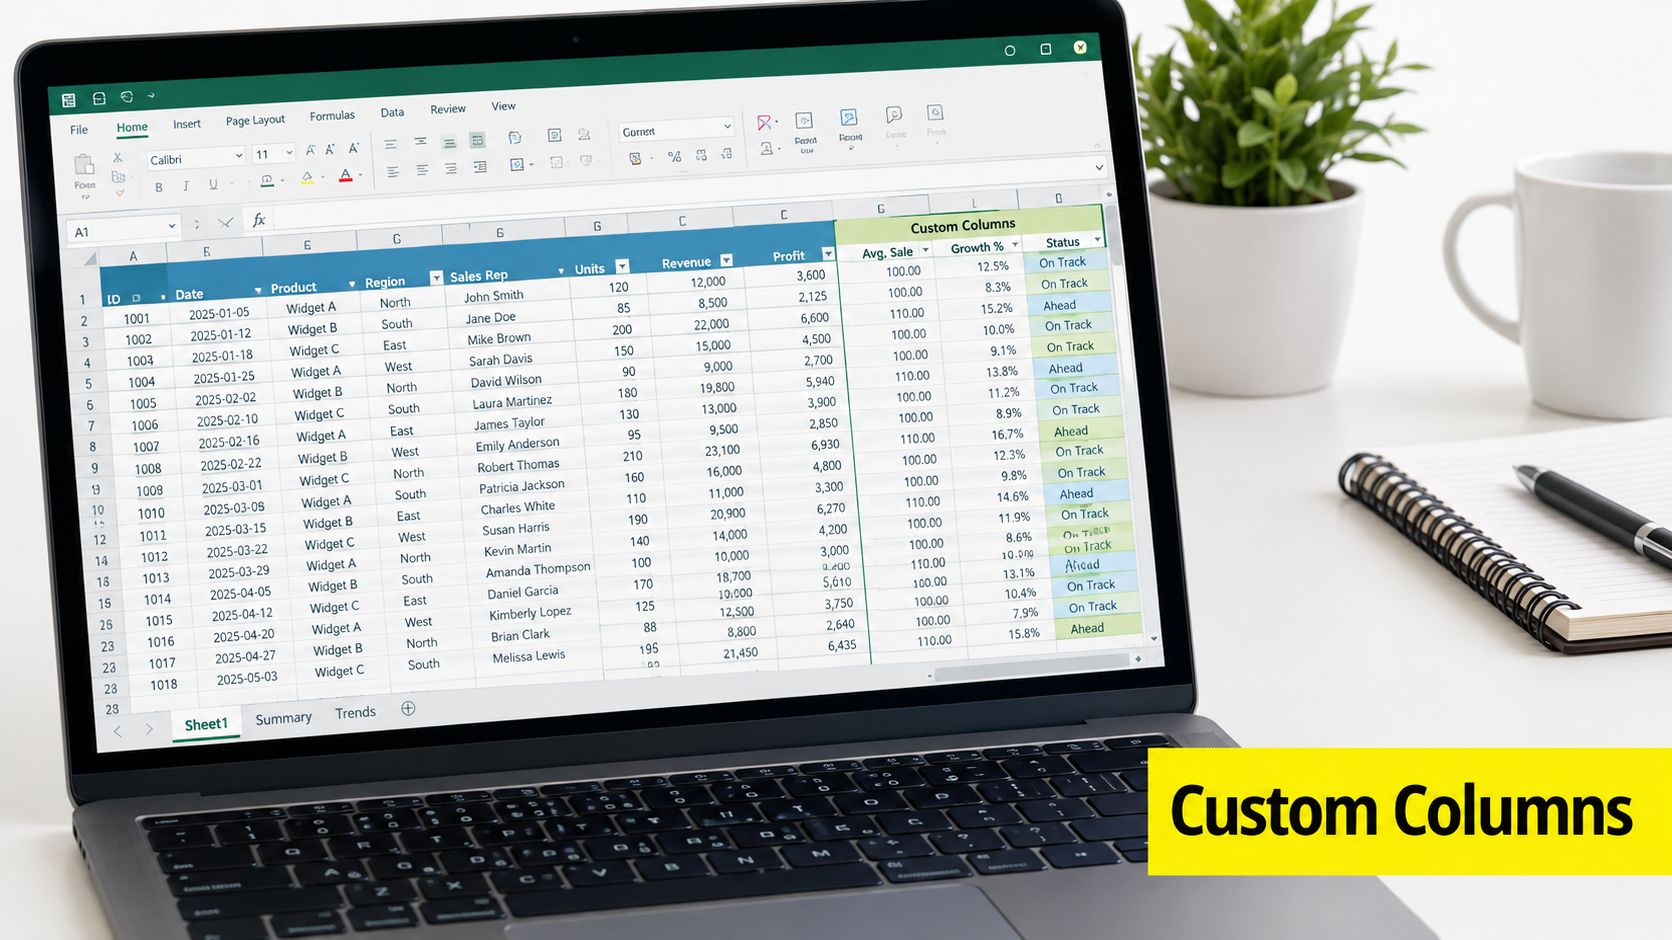
Start with the metrics your business relies on. In Google Ads, that usually means building columns around conversion rate, cost per lead, conversion value, impression share, and the loss metrics you use to control spend. Separate raw volume from efficiency. Impressions alone rarely tell you whether a campaign deserves more budget.
A practical setup usually has two views. One is for daily optimization. Keep it narrow, readable, and tied to active management. The other is for strategic review, where you can add segment breakdowns or longer comparisons to check whether a pattern is real or just noise.
How to work the date controls
The useful comparison is rarely month over month. It is before the offer change versus after the landing page revision, or during the promo versus after the promo ended.
Use custom ranges when:
Testing creative changes, because a fixed month often mixes old and new assets.
Comparing launch windows, because early learning phases do not behave like steady-state performance.
Rechecking anomalies, because a sudden spike or drop is easier to explain inside a tight window.
Use preset ranges when the question is broad, like whether performance improved quarter over quarter. The point is not to pick one forever. The point is to match the reporting window to the business question.
The reporting table already includes a date-range control, so there is no reason to rebuild time windows in spreadsheets when the platform can do it directly. If you are still exporting everything and trimming dates later, you are spending time on plumbing instead of analysis. The Google Ads interface is built to show the period that matches the decision, and that is the part worth using well.
Build views that answer one question
Do not overload one report with every metric under the sun. A report that tries to serve media buyers, founders, and finance at once usually serves nobody well. Build one saved view for each recurring decision, such as budget allocation, lead quality review, or weekly pacing.
The sharpest teams keep their columns short enough to read in one scan and specific enough to support action. If a column does not change what you would do next, it does not need to sit in the default table.
Selecting the Right KPIs for Your Business Model
A useful KPI matches how money moves through the business. E-commerce teams need one view of success, service businesses need another, and lead-gen funnels that close weeks later through sales calls or follow-up sequences need a different set again.
For e-commerce, the dashboard should start with revenue quality, not traffic efficiency. That means watching whether ad spend turns into profitable order volume, then checking return data and margin from the backend so the platform view does not flatter low-value sales. For local service businesses and coaches, the main signals are lead quality, booked calls, and closed revenue, because cheap leads are useless if the sales team cannot turn them into customers.
Business Model | Primary KPIs | Secondary KPIs | Reporting Frequency |
|---|---|---|---|
E-commerce | Revenue, ROAS, contribution margin, MER | Conversion value, AOV, product-level performance | Daily for pacing, weekly for decisions |
Local services | Cost per booked call, lead-to-close rate, qualified lead cost | Form fills, show rate, call quality | Daily for lead flow, weekly for quality |
Coaches and consultants | Cost per application, booked-call rate, close rate | Lead source mix, landing page conversion rate | Daily for intake, weekly for pipeline |
Higher-ticket B2B | Pipeline value, CAC, SQL rate | MQL rate, form completion, demo bookings | Weekly with monthly rollup |
A lot of teams report what is easy to pull instead of what helps them make a decision. PPC reporting best practices helps here, especially when you need a consistent rule for which numbers belong in the main view and which ones stay in the background.
Use the dashboard to answer ownership questions, not vanity questions. If a KPI does not help the person reading the report decide what to do next, it does not belong front and center.
Make the report match the audience
Executives usually want bottom-line context. Media buyers need enough detail to see where budget should move next. Sales teams care about lead quality and response speed. Those groups can all look at Google Ads reporting, but they should not be looking at the same table.
Segmented reporting earns its keep here. A good setup gives finance a high-level summary, gives the media buyer the levers needed for budget decisions, and keeps the sales team focused on what reached the pipeline, not just what clicked.
Reconciling Platform Data with GA4 and Your CRM
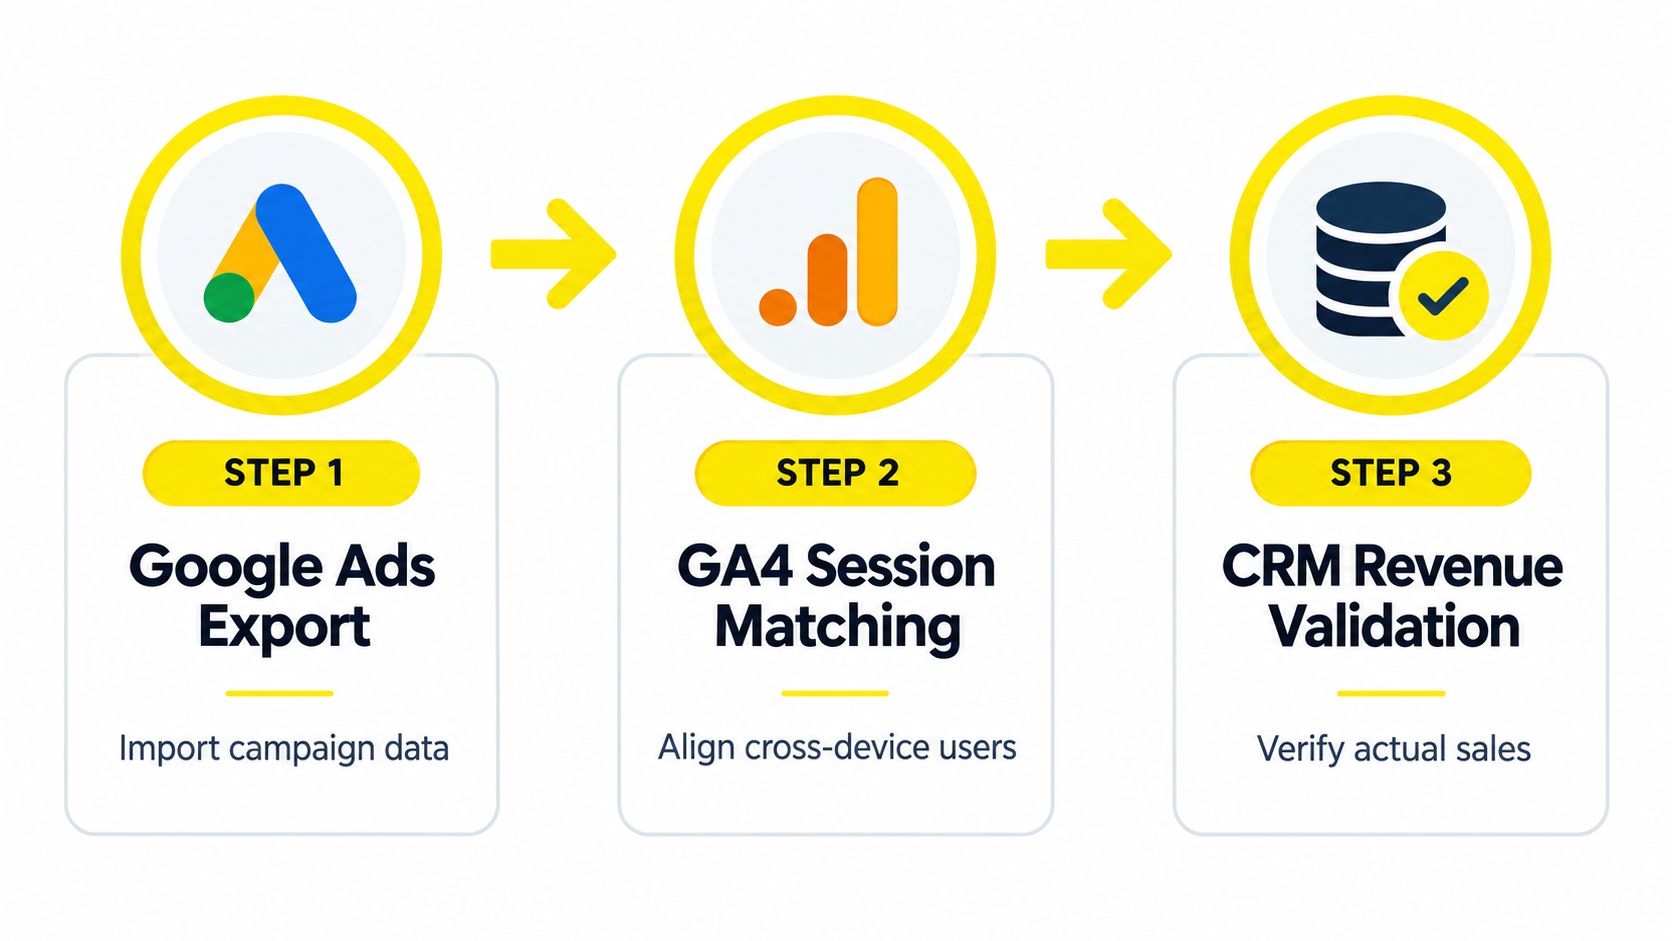
The first mistake is expecting Google Ads, GA4, and your CRM to agree line for line. They use different clocks, different attribution rules, and different conversion definitions, so a mismatch usually points to a reconciliation problem, not a broken account.
Google reports conversions by time of click, not by the time the final action happens Google Ads conversion reporting help. That matters when you compare platform data against CRM records, because late conversions can land in a different reporting period, and lead-gen teams often see a real gap between ad-platform totals and backend closed-lead counts. Set your variance threshold before the first comparison, then judge the pattern instead of chasing exact parity.
Start with identity and timing
Check whether click IDs survive the full journey. If GCLIDs get stripped, redirects break parameters, or tag changes never publish cleanly, Google Ads cannot reliably connect the downstream action to the original click. Consent Mode can change what gets measured without changing the recorded events, so treat it as a measurement layer issue, not a traffic issue.
Then line up the dates. Use click date when you reconcile Google Ads with backend systems, because that usually matches how Google assigns conversion credit. Use conversion date only when you want to measure lag from first click to final action.
Read fractional credit correctly
Data-driven attribution is the default for most conversion actions, and it can split credit across multiple touchpoints Google Ads attribution help. That is why conversions may show up as decimals. It is a model choice, not a reporting error.
Once that is clear, the reconciliation flow gets simpler:
Validate click ID capture so each tracked session can be traced back to the ad click.
Confirm the attribution model and conversion window before comparing platform data with CRM or GA4.
Compare by click date first, then use conversion date as a secondary check when the sales cycle creates lag.
The cleanest reporting setups do not force every system to match perfectly. They document the expected variance, keep the comparison method consistent, and use the same rules each week. That keeps the discussion on conversion quality, tracking integrity, and revenue quality, not spreadsheet noise.
Interpreting AI-Driven Search and Performance Max
The old keyword-only mindset doesn't work as well once automation takes over more of the matching logic. In Performance Max and AI-driven Search surfaces, the reporting question becomes whether the system is still giving you usable visibility into what drove performance.
Google's 2025 and 2026 updates introduced richer asset-level reporting and new AI Max-related surfaces, including search-term match source and combination views Google Ads reporting updates. That changes the job. You're no longer only checking which keyword converted, you're checking which asset, which query pattern, and which combination of signals earned the result.

What to look at instead of old keyword lists
Start with asset-level performance. Look at impressions, clicks, and conversions on headlines, descriptions, images, and other creative components, then check whether the winning assets also support downstream efficiency. If an asset attracts attention but never contributes to qualified demand, it may be a volume piece, not a profit piece.
Then inspect the new search-term and combination surfaces. These views help you understand what the automation is matching against, even when you don't have the old familiar keyword report in front of you. That matters because opaque automation is still automation, and blind trust is expensive.
How to make decisions with less visibility
The biggest mistake is expecting old-style control from a system that's designed to abstract it away. Instead, use the reporting you do have to answer narrower questions. Which asset types pull qualified traffic? Which landing pages receive the best engagement? Which query patterns seem to support real intent?
Treat automation like a black box with windows, not like a black box with no visibility at all.
If the report shows an asset is getting served but not producing meaningful outcomes, change the creative or the landing page before you blame the campaign type. If the report shows broad traffic quality but weak backend conversion, the issue may be post-click, not in the ad system itself.
Troubleshooting Common Tracking and Attribution Breaks
Most reporting problems aren't reporting problems at all. They're tracking problems that show up inside the reports. If the plumbing is off, Google Ads, GA4, and your CRM will disagree even when spend and traffic look steady.
The first move is to check the setup, not the chart. A bad redirect can strip click IDs, a delayed tag update can break conversion capture, and consent settings can change what gets recorded. If you compare platform numbers before checking those pieces, you end up arguing with the symptoms.
A practical checklist
Missing GCLIDs: Confirm that ad click identifiers survive the full journey, from landing page through form submission.
Redirect chains: Test whether intermediate redirects strip URL parameters before the conversion fires.
Unpublished tag changes: Check whether the latest tracking edits were pushed live.
Consent Mode mismatches: Review whether consent settings are blocking or altering measurement in ways the team didn't expect.
Attribution model and window: Confirm the model and conversion window match your CRM logic before comparing counts.
Window and count alignment: Make sure your conversion window and counting method match the business model before you compare reports.
The fastest way to find the break is to isolate where the count first diverges. If Google Ads and GA4 disagree, check tagging and session logic. If GA4 and CRM disagree, check form capture, lead routing, offline import logic, and sales-stage definitions.
A weekly report only works when the team trusts the inputs. That trust comes from consistent setup, clean comparison rules, and a clear split between platform credit and actual business outcomes. When those pieces stay aligned, the reporting stops drifting and the backend numbers become easier to reconcile.
Comments