
Paid Ads Funnel Explained: Stages, Metrics and Fixes

You're paying for ads, people are clicking, and the dashboard looks busy. But orders are uneven, leads aren't booking, and you're not sure whether to change the ads or spend more. A paid ads funnel helps you find the missing step, provided you judge it by the customers your advertising causes, not just the activity a platform reports.
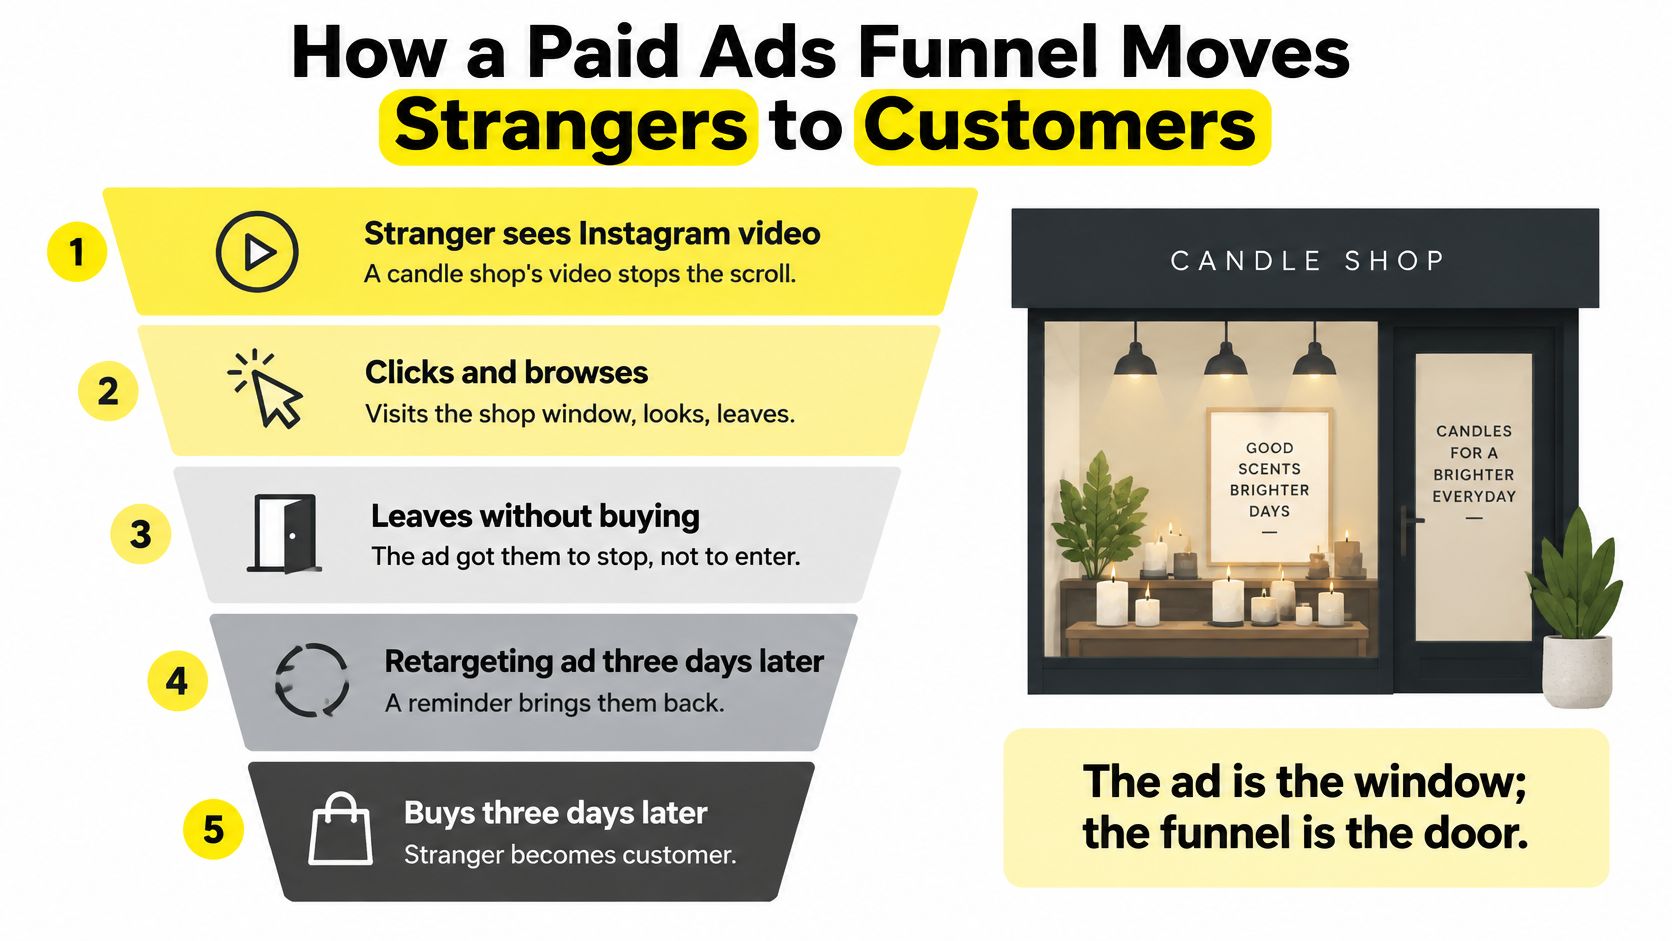
How a Paid Ads Funnel Moves Strangers to Customers
Say you run a candle shop and promote an Instagram video showing someone winding down after work. A stranger clicks, browses your candles, and leaves. In this hypothetical journey, they return three days later after seeing a retargeting ad and buy.
Which ad made the sale? That's the wrong starting question. First, understand what each encounter helped the shopper do.
Your ad is the shop window that makes someone stop. Your landing page invites them inside. Your offer and checkout help them decide and pay, while follow-up gives them a relevant reason to return.
The illustration turns that journey into individual customer actions.
Match the Ad to the Customer's Readiness
Demand creation introduces an offer before someone starts searching for it. Social and video can do that for the candle shopper. Demand capture reaches someone already looking, such as a person searching Google for a candle gift set.
The scale of both matters: the IAB's report, with research conducted by PwC, recorded $258.6 billion in U.S. internet advertising revenue in 2024, including $102.9 billion from search and $88.8 billion from social advertising. These categories describe a broad advertising ecosystem, not a prescription to buy every channel.
Organize your funnel around customer readiness rather than platform names.
Stage | Reader's state | Job of the ad or page | Metric that proves it works |
|---|---|---|---|
Awareness | Does not yet know the problem or the brand | Name a problem immediately | Reach, click-through rate, cost per thousand impressions |
Consideration | Knows the problem, comparing options | Show proof, a clear offer and what happens next | Landing page visits, cost per click, scroll or video view rate |
Conversion | Ready to act, checking price and trust | Make the next step simple and the total cost clear | Conversion rate, cost per lead, cost per purchase |
Retention | Went quiet or bought once | Bring them back with a relevant reason | Repeat purchase rate, return on ad spend from existing customers |
These metrics show whether each step is functioning. They don't, by themselves, prove that advertising created a customer.
For a local service business, the conversion might be a qualified appointment rather than an order. For a tax advisor, consideration might involve watching a webinar before requesting a consultation. The stages stay useful even when the actions change.
Sketch your funnel as boxes labeled awareness, consideration, conversion, and retention. Under each, write the customer action you need, not the campaign you intend to launch.
Metrics to Track at Every Funnel Stage
A cheap click is only useful if it starts a worthwhile customer journey. Your reporting needs to connect the people you reach with the purchases, appointments, and revenue that follow.
That connection involves attribution, which Google Analytics defines as assigning conversion credit to ads, clicks, and other factors along a customer's path; its reporting options include rules-based last-click models and data-driven attribution.
Under last click, the final eligible interaction receives the credit. A data-driven model distributes credit using observed conversion-path data. The same campaign can therefore look more or less valuable when you change models, even though the underlying sales haven't changed.
Build a Reporting Ladder
Keep related measurements together so you can investigate a weak result.
Acquisition: Track impressions, clicks, and cost per click. Calculate click-through rate by dividing clicks by impressions.
Conversion: Track landing-page conversion rate, cost per lead, and cost per purchase. Define the conversion explicitly so a newsletter signup isn't confused with an order.
Business outcomes: Track qualified opportunities, new customers, customer acquisition cost, and contribution-margin return on ad spend.
Customer acquisition cost divides your defined acquisition costs by new customers. State whether those costs include only media or also creative, agency fees, and sales expenses. Otherwise, people can use the same label for different calculations.
For contribution-margin ROAS, divide revenue remaining after relevant variable costs, before advertising, by ad spend. Document which costs you subtract, including fulfillment, payment processing, and refunds where applicable.
Practical rule: Judge the top layer by the bottom layer. Cheaper clicks aren't an improvement if fewer of those visitors become profitable customers.
Use Benchmarks Without Chasing Them
WordStream's 2025 analysis of 16,446 U.S.-based Google Ads campaigns recorded an average conversion rate of 7.52% in 2024, according to the paid advertising benchmark summary. Treat that as a rough reference, not a target for your store or consultation funnel.
A purchase and a lead submission require different commitments. Even your own conversion rate becomes misleading if you change the event being counted.
Pull last month's report and check whether it contains all the reporting layers. If it ends at clicks or form submissions, connect your order system or customer relationship management system before making confident budget decisions.
Ad Creative and Offers That Start the Funnel
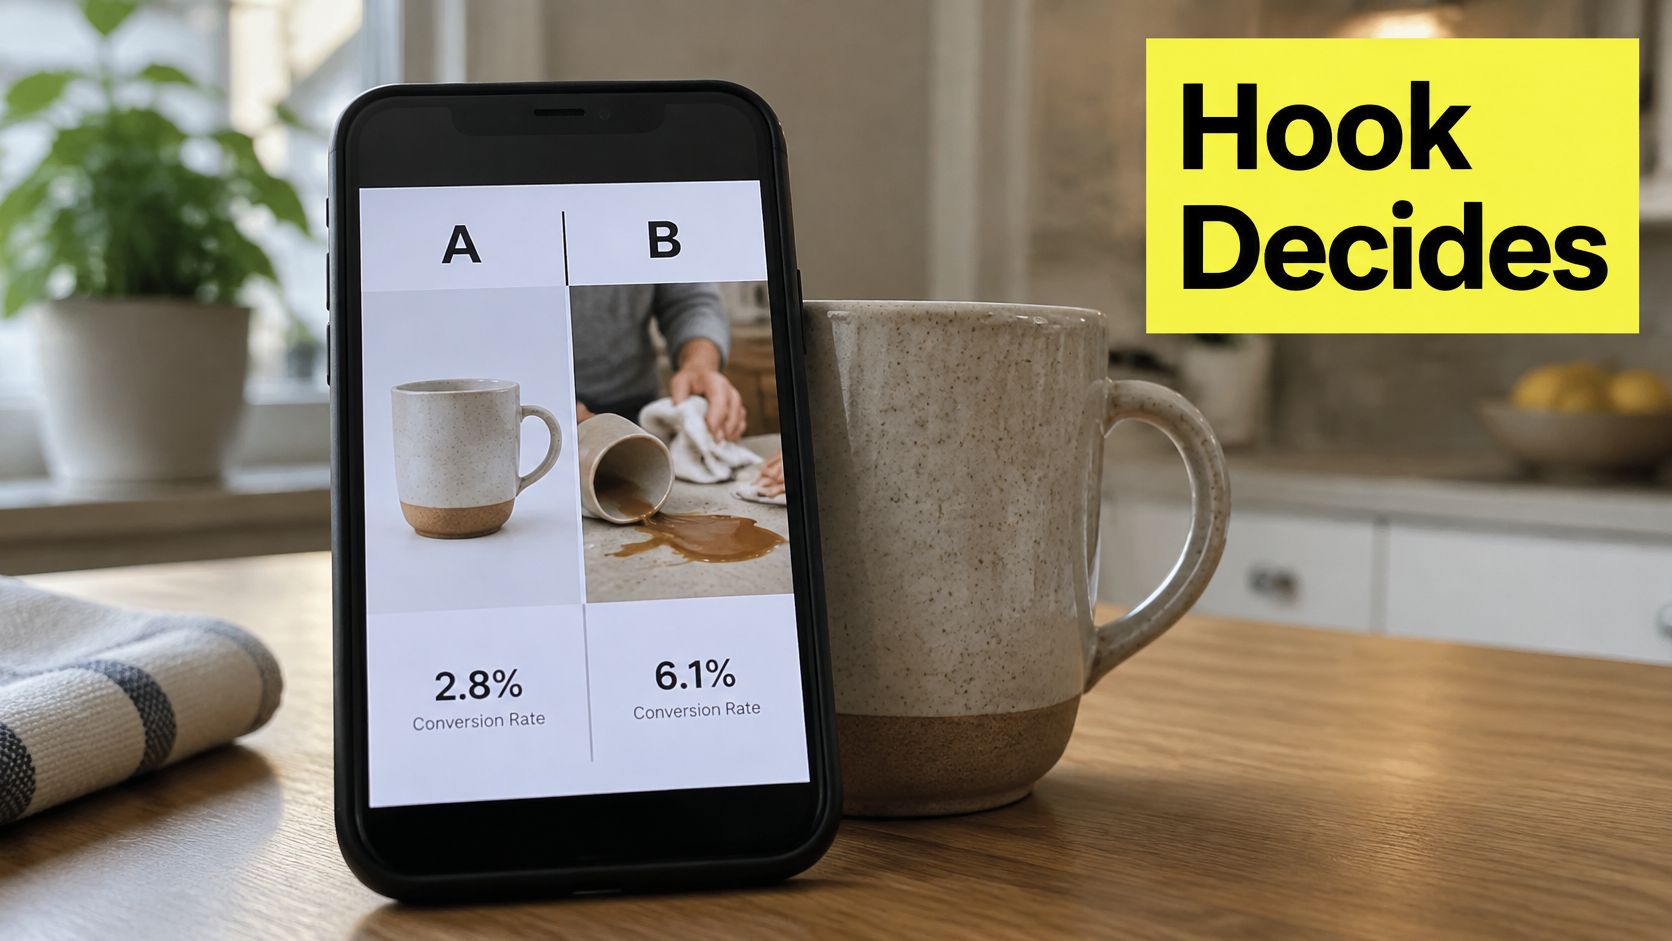
Compare a photograph of a mug with a video opening on someone discovering their coffee has gone cold during a meeting. The photograph introduces the object. The frustration-led opening gives a particular buyer a reason to care.
Neither approach automatically wins. The hook determines who pays attention, while the offer helps the right person decide whether to continue.
This visual shows how creative variants can be compared, but your decision should include downstream customer quality.
Give Each Creative a Specific Job
For unfamiliar audiences, demonstrate a recognizable problem without assuming they know your brand. For people who've already engaged, show evidence: a product demonstration, an authentic customer review, or an explanation of how the service works.
For shoppers close to buying, make the decision concrete. State the price or next step, explain delivery or appointment details, and present any genuine guarantee with its conditions. Don't invent a promise your business can't honor.
Shopify merchants connecting these decisions to store campaigns can use YipSMS Inc.’s guide to ecommerce PPC for Shopify as a companion planning resource.
Test the Opening Without Changing Everything
Use a controlled creative routine:
Keep the offer fixed. Write alternative openings around frustration, desired outcome, and demonstration.
Make the comparison fair. Keep the audience, destination, budget allocation, and evaluation window consistent.
Check attention, then intent. Compare click-through rates, but also inspect purchases or qualified leads before choosing a winner.
Retire clear underperformers. Don't decide from a handful of impressions or an isolated order.
For an additional creative walkthrough, use the video below.
Use vertical video for social placements that suit it, and search text that reflects the customer's query. Adapt the presentation while preserving the promise, so the landing page still feels like the logical destination.
Write alternative hooks for your strongest offer this week. Set a test budget you can afford to learn from, and decide what customer outcome will determine the winner.
Landing Pages and Checkout Where Revenue Leaks
Baymard's checkout usability research reports a global average cart-abandonment rate of 70.19% and estimates that resolving documented checkout-design problems could increase conversion rates by an average of 35.26% for large e-commerce sites. Those are broad e-commerce findings, not a forecast for your paid visitors.
They do establish a useful priority: don't assume more traffic is the next investment. You may already be paying to attract shoppers who encounter avoidable obstacles.
A long form asks for effort before the shopper sees enough value. Unexpected shipping costs change the deal. A vague payment error leaves someone unsure whether to retry or risk a duplicate charge.
Separate Cart Problems From Checkout Problems
Cart abandonment means someone created a cart but didn't purchase. Checkout abandonment concerns shoppers who began checkout and didn't finish, a distinction discussed in Shopify's checkout optimization guide.
Use the right denominator. Divide purchases by checkout starts when investigating checkout completion, and divide checkout starts by add-to-cart actions when investigating the transition into checkout.
Track product views, add-to-cart actions, checkout starts, and purchases separately. Validate that events fire correctly, especially after payment redirects, before diagnosing a customer experience problem.
Leak point | Signal in your data | First fix to test |
|---|---|---|
Landing page | Good click-through rate, few form starts | Match the headline to the ad promise and cut the form to essentials |
Product or offer page | Visits high, add-to-cart low | Show price, shipping and guarantee above the fold |
Checkout start | Many checkout starts, few purchases | Show total cost early and fix error messages |
Mobile experience | Conversion rate far lower on phones | Test the mobile layout and payment options first |
Lead follow-up | Leads captured, few booked calls | Reply within minutes and offer a booking link in the thank-you step |
Test the Obstacle, Not a Redesign
Choose the change most directly connected to the observed problem. If customers leave after seeing delivery charges, test earlier cost disclosure rather than changing button colors.
Break results out by device, campaign, and new-versus-returning visitors. An overall conversion rate can hide a broken mobile payment flow behind healthy desktop performance.
For lead generation, inspect the equivalent handoff. Submit your own form, check whether the confirmation explains what happens next, and verify that the salesperson receives the details needed to respond.
Buying more traffic before checking the purchase path can mean paying to send more people into the same obstacle.
Open your checkout on a phone and complete a test order. Time the process, count unnecessary fields, and record confusing instructions. Then test a focused fix against purchase completion and contribution margin, not just whether more people pressed the checkout button.
Retargeting and Follow-Up That Bring Visitors Back
Showing the same discount to everyone who visited your website ignores what those visitors did. Someone who glanced at a product needs a different message from someone whose payment failed.
Retargeting should answer the visitor's next unresolved question. It shouldn't repeat the acquisition ad until they buy.
Match the Reminder to the Behavior
Build audiences around meaningful actions, while avoiding so many small groups that delivery becomes impractical.
Viewed a product without adding to cart: Demonstrate its use, explain the difference between options, or answer a common suitability question.
Added to cart without starting checkout: Clarify shipping, returns, or what's included. Don't assume price is the obstacle.
Started checkout without purchasing: Offer a direct path back and accessible support for payment or ordering problems.
Bought previously: Show a relevant refill, complementary product, or reason to reorder, not another first-purchase pitch.
Start with shorter reminder windows for cart and checkout visitors, and allow more consideration time for product viewers. For consultation offers, match the window to how long people normally need to evaluate the commitment.
Use frequency controls where available. Where they aren't, inspect frequency alongside response and customer feedback, then adjust spend, audience duration, or creative. Exclude recent purchasers from acquisition messaging unless the offer applies to them.
Make Follow-Up a Human Handoff
A submitted form isn't a booked appointment. Assign an owner, route the lead into your CRM, and make the next action obvious on the confirmation page.
A practical sequence starts with a prompt acknowledgment and booking link. If the person hasn't booked, send a reminder that answers a likely scheduling question. A later message can share useful preparation advice or explain what the consultation will cover.
Follow-up check: Every message should help someone decide or complete a task. If it only asks whether they saw your last message, improve it.
Respect consent and stop rules for the channels you use. Remove booked prospects from booking reminders, and make sure replies reach a person who can help.
List your largest behavior-based audiences and assign each a distinct message and duration. Then inspect the CRM statuses: captured, contacted, booked, attended, qualified, and won. That sequence tells you whether the problem is missing leads or an incomplete handoff.
Measuring Whether the Funnel Creates New Demand
A strong reported return on ad spend can mean you reached people who were already going to buy. That's especially important when a campaign targets recent visitors, existing customers, or people searching for your brand.
The question is what happened because of the advertising? Attribution describes credited paths. Incrementality testing estimates the difference between advertising and a credible no-ad comparison.
Privacy restrictions and reduced access to cross-platform identifiers complicate user-level measurement, as discussed in Ruler Analytics' advertising attribution guide. Use platform reports as operational tools, not complete proof of causation.
A profitable-looking dashboard still deserves an independent check.

Choose a Credible Comparison
The right test depends on how much control you have over exposure.
Geographic holdout: Run the campaign in selected regions while withholding it from comparable regions. Check historical sales patterns before assigning locations.
Audience split: Randomly divide eligible people into advertising and control groups where the tools support reliable exclusions.
Conversion-lift experiment: Use a platform's supported experiment to compare eligible exposed and withheld groups, subject to its requirements.
For a small business, limited sales volume may make a result inconclusive. Don't force a confident conclusion from a test that cannot distinguish a meaningful effect from ordinary variation.
Protect the Test From Misleading Results
Allow for sales lag, the time between exposure and purchase. A consultation campaign may need time for appointments to happen and contracts to close.
Keep promotions, pricing, and sales handling comparable. A control group becomes contaminated if its members receive the supposedly withheld campaign through overlapping targeting or another account.
For businesses connecting online acquisition with visits to physical locations, Purple Engage's resource on how to measure ROI on guest WiFi campaigns offers a related measurement perspective. Keep the outcome definition consistent across online and offline reporting.
Negative measured lift means the exposed group performed worse during the test. Investigate uncertainty, group imbalance, execution problems, and possible harmful effects before concluding that advertising reduced sales.
A campaign with lower attributed ROAS can still deserve more budget if it causes more profitable new customers. Choose a campaign, define the comparison group, and set the evaluation period around your actual sales cycle before launching.
Finding the Stage to Fix First
Fix the stage with the strongest credible opportunity to recover profitable customers per dollar spent. That isn't necessarily the stage with the largest percentage drop, and it's rarely something you can identify from cost per click alone.
Say a hypothetical store has plenty of paid visitors, some add-to-cart activity, and many checkout starts, but few completed orders. Checkout deserves investigation because those shoppers have already expressed purchase intent.
However, the drop doesn't prove the checkout design is broken. Verify event tracking, inspect payment failures, and check whether delivery costs or unavailable shipping destinations explain the exits.
Turn the Diagnosis Into a Decision
Build a compact working sheet before making changes.
Decision | What to write down |
|---|---|
Suspected obstacle | The exact step where customers stop |
Supporting evidence | Stage completion, customer feedback, or error logs |
Proposed change | A focused modification tied to that obstacle |
Primary outcome | Purchases or qualified customers |
Financial check | Contribution margin after relevant costs |
Guardrail | Refunds, cancellations, or lead quality |
Estimate the opportunity using your own customer value and realistic capacity. A service business shouldn't increase bookings beyond what its team can fulfill, and a store shouldn't count low-margin orders as an automatic win.
Establish Proof Before Increasing Spend
Run a controlled test long enough to capture normal buying behavior and delayed outcomes. Keep unrelated changes out of the experiment, and record what happened even when the result is inconclusive.
When you're ready to operationalize a proven improvement, Rapid Ads campaign scaling workflows can serve as a companion resource for organizing the next steps. A scaling workflow should follow evidence, not replace it.
Check whether the improvement holds at the business-outcome level, then assess incremental customer impact before materially increasing budget. More purchases attributed to a campaign aren't sufficient if margin falls or existing buyers move into a paid channel.
This week, choose the weakest economically important stage in your own funnel. Write down its baseline completion rate, the customer outcome you want, and the change you'll test before editing anything.
At Wojo Media, we optimize your offer and guarantee, then build a landing page and ad copy to match, so the promise and purchase path work together. Visit Wojo Media to book a free demo call with Jason or a growth manager, the first step toward a custom paid ad strategy built around your funnel and business outcomes.
Comments