
Performance Marketing Dashboard: What to Track and Why

It's Monday morning and you're in Meta Ads Manager. Last week's campaign shows a 4.2 return on ad spend, the strongest number on the screen, and the obvious move is to push more budget into it. Then you open Shopify, total last week's revenue yourself, and the figure is lower than what the ad platform reported.
Nothing is broken. You're comparing a credit statement with a bank statement. The platform counted every purchase from anyone it had shown an ad to in the past week, including people who were already going to buy. Your store counted money that arrived.
A performance marketing dashboard exists to make that gap visible. It puts spend, credited conversions, real revenue and the cost ratios built from them on one screen, so the question stops being which platform looks best and becomes where the next dollar does the most work.
What a Performance Marketing Dashboard Tracks
A performance marketing dashboard is one screen that pulls spend, impressions, clicks, conversions, revenue and the ratios built from them out of Meta, Google, TikTok, YouTube and any other network you pay. The point isn't prettier reporting. It's judging budget across the whole account instead of inside one platform's tab.
The case for a consolidated view shows up in market data. The latest IAB and PwC Internet Advertising Revenue Report puts U.S. internet advertising revenue at $294.6 billion in 2025, up 13.9% year over year, with social media at $117.7 billion (up 32.6%), digital video at $78 billion (up 25.4%) and commerce media at $63.4 billion (up 18%). The IAB started that benchmark in 1996, commissioning PwC to measure online ad revenue from sellers on a consistent basis, which is exactly the discipline a dashboard needs: comparable measures across channels and periods, not one network's estimate of its own importance.
Growth arriving in three channels at once has a practical consequence. A shopper can meet you on TikTok, search your brand on Google and buy inside a marketplace in the same week, and three platforms will each report that sale as theirs. A dashboard that sums those reports tells you the business grew more than it did.
The Metrics That Belong on One Screen
Seven measures carry most of the decisions. Keep them on the top row with week-over-week and month-to-date comparisons beside each, and print the attribution model and date range next to every ratio. A number without its model is a guess wearing a suit.
Core dashboard metrics and the decisions they inform
Metric | What it measures | Decision it informs |
|---|---|---|
Spend | Total cost by platform, campaign and day | Pacing against budget |
Attributed conversions | Conversions credited to each channel under one model | Which channels earn more budget |
Attributed revenue | Sales or lead value credited under one model | Revenue contribution by channel |
Cost per acquisition | Spend divided by conversions | Whether each sale or lead is affordable |
ROAS | Attributed revenue divided by spend | Channel ranking and scaling limits |
Cost per qualified lead | Spend divided by leads that pass a sales filter | Lead quality for service businesses |
Conversion rate by funnel stage | Share moving from click to lead, cart or sale | Landing page and offer fixes |
Two rows deserve extra weight for service businesses. Cost per qualified lead only means something once a sales filter exists, so a med spa that counts every form fill as a lead is really tracking cost per form fill. Revenue per dollar, meanwhile, is the row that survives contact with a finance team.
A three-question test for any dashboard: Is spend pacing to plan across channels? Is cost per acquisition inside target for each channel, not just on average? Is revenue per dollar holding, rising or slipping against last month?
Where spend and pipeline live in separate tools, the two reports drift apart within a month. Fixing misaligned sales and marketing dashboards covers the plumbing, from shared definitions for a lead to one source of truth for its status.
How Spend Becomes Reported Revenue
An aircraft's instrument panel doesn't fly the plane. Each gauge reads a different system, fuel, altitude, airspeed, and the pilot trusts the panel only when those gauges agree with one another. A dashboard does the same job for ad spend. It reads your ad accounts, your analytics tool and your order system, then shows you where those readings disagree.
The flow below is the whole journey in one picture, from money leaving the account to a revenue figure you can defend in a meeting.
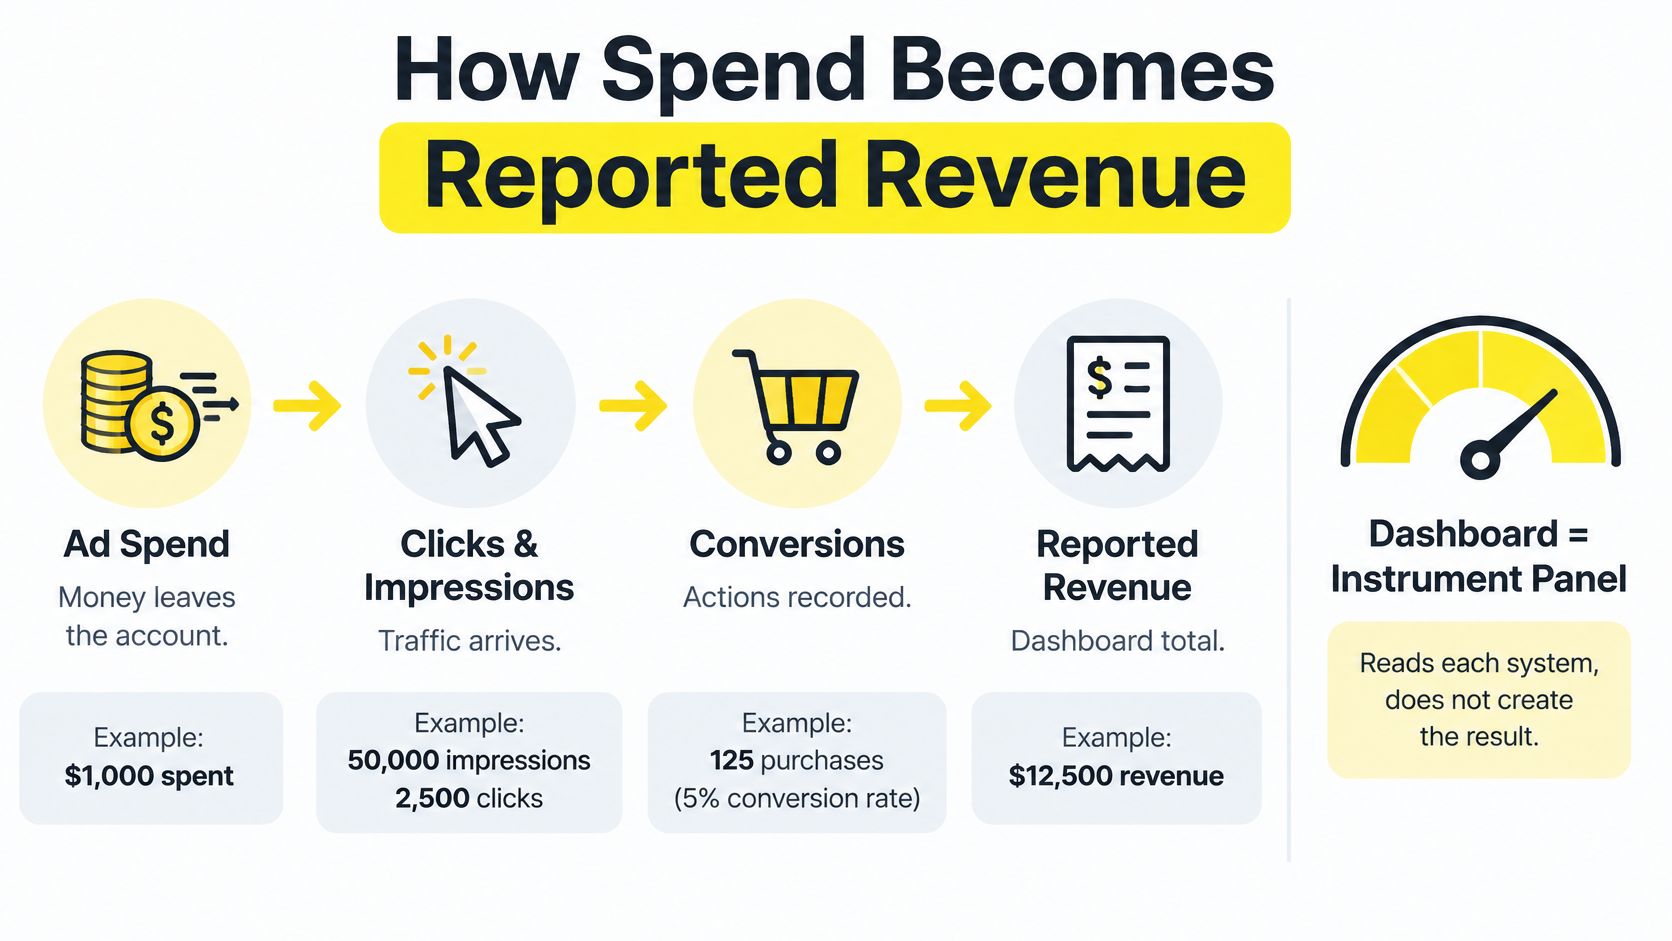
Six Stages From Spend to Reported Revenue
Pull spend and impressions daily, per campaign and ad set. The common slip here is currency and time zone. If the ad account bills in USD while the store reports in CAD, or the platform's day rolls over in UTC while the store closes at local midnight, daily totals disagree by a few percent and you'll spend a week hunting a bug that doesn't exist.
Import clicks and sessions from your analytics tool. Campaign naming bites here. "Paid_Social" one week and "paid-social" the next become two rows that never merge, splitting a campaign's history in half.
Map conversions, with their values, to the campaign that drove them. Duplicate events are the usual failure: two pixels firing on one purchase double the revenue line and flatter your ROAS.
Join those conversions to the CRM or order system. That's where qualified leads, refunds and closed revenue appear. Without a join key, a lead can never be traced back to the ad that produced it.
Calculate cost per acquisition, ROAS and cost per qualified lead from the joined table. Never from the platform export, which knows nothing about refunds or whether a lead answered the phone.
Flag every disagreement. Set a tolerance, 5% is workable for most accounts, and surface each row where platform totals and backend totals differ by more than that.
Draw the map before you build anything. One page listing each metric, the system it comes from and the field it joins on will save more time than any chart setting you'll ever adjust.
Sketch that page today. Two columns, metric and source, with an arrow marking where the join happens.
Attribution Models and Who Gets the Credit
A shopper watches a TikTok video about ceramic mugs on Monday. On Wednesday she clicks a Google non-brand ad for stoneware and reads the size guide. On Friday she searches the brand name, clicks the first result and buys.
Last-click attribution gives 100% of that sale to the branded search. The TikTok video that started everything gets nothing, so it looks like waste and the budget moves to the channel that merely happened to be present at the end. This is the ordinary path, not an edge case.

An attribution model decides how credit is split across those touches. Google Analytics defines attribution as assigning credit to the different ads, clicks and factors along the user journey, and its data-driven model distributes credit according to observed conversion behavior rather than handing everything to the final interaction.
That data-driven approach compares converting and non-converting paths. Google lists time to conversion, device type, number and order of ad interactions and creative type among the inputs, and assigns credit through a counterfactual comparison between the path that happened and modeled alternatives, as described in Google's explanation of data-driven attribution. In practice, that means the dashboard can show fractional credit across Facebook, Instagram, TikTok, Google and YouTube instead of adding up three platform totals.
Attribution models compared
Model | How credit is assigned | Best used for | Main risk |
|---|---|---|---|
Last click | 100% to the final interaction before conversion | Quick checks of bottom-funnel search | Overcredits branded search and retargeting |
First click | 100% to the first interaction | Measuring top-of-funnel discovery | Ignores the nurturing that closed the sale |
Linear | Equal share to every touchpoint | Long paths with many touches | Treats weak and strong touches the same |
Data-driven | Credit based on observed conversion behavior | Accounts with enough conversion volume | Needs volume before results are stable |
Two rules keep the table honest:
Never add platform-reported conversions together. Each platform claims the same sale, so the sum will exceed your actual order count every time.
Run last-click and data-driven side by side. A wide gap between them marks a campaign being under- or over-credited by a rule, and that gap is where your next budget question lives.
Store the raw fields per event so any model can be recalculated later: timestamp, source, medium, campaign, creative, device, conversion value and modeled credit. Models change. Event data doesn't.
Enough Conversions for Numbers You Can Trust
Google's legacy attribution documentation states that its data-driven model generally required at least 600 conversions within 30 days before becoming available, as recorded in the Google Analytics attribution guidance. That threshold is a reality check. Most local-service, coaching and real-estate accounts never see that volume in a month, yet plenty of dashboards rank those campaigns by ROAS to two decimal places.
Precision depends on sample size, and the dashboard should say so out loud rather than leaving it to the reader's intuition.
Three Labels Every Campaign Should Carry
Sufficient volume: enough conversions for the model to be stable. Only these campaigns get ranked by ROAS, cost per qualified lead or revenue per touchpoint.
Directional: enough data to see a trend, not enough to rank. Read these as movement, not standing.
Insufficient sample: judge these on a longer window, or on lead quality alone. Hiding the ranking column for a month is cheaper than reallocating budget on six conversions.
Keep three path metrics beside the ratios: touchpoint count, time lag and path sequence. A long lag argues for a longer lookback window and a reconciliation date you put on the calendar. Many touchpoints suggest prospecting deserves assisted credit even when it closes nothing directly. Short paths with high close rates justify concentrating spend on high-intent search or retargeting.
Before scaling anything, label the campaign, hide the ranking for weak labels, and compare immediate-lead efficiency against backend outcomes. If both move in the same direction, you have permission to spend more.
Measuring Real Lift and Revenue Beyond Platform Reports
A high ROAS is a claim about credit, not a claim about cause. Retargeting and branded search collect credit for buyers who were already coming back, which is why the strongest-looking line on a dashboard is often the one adding the least.
Teams know this and are acting on it. 52.0% of U.S. brand and agency marketers reported using incrementality testing in 2025, and another 36.2% planned to invest in it over the following 12 months, according to eMarketer's coverage of the shift toward incrementality. The gap isn't whether lift matters. It's knowing which campaigns qualify for a holdout and how to read the result when your sample is small.
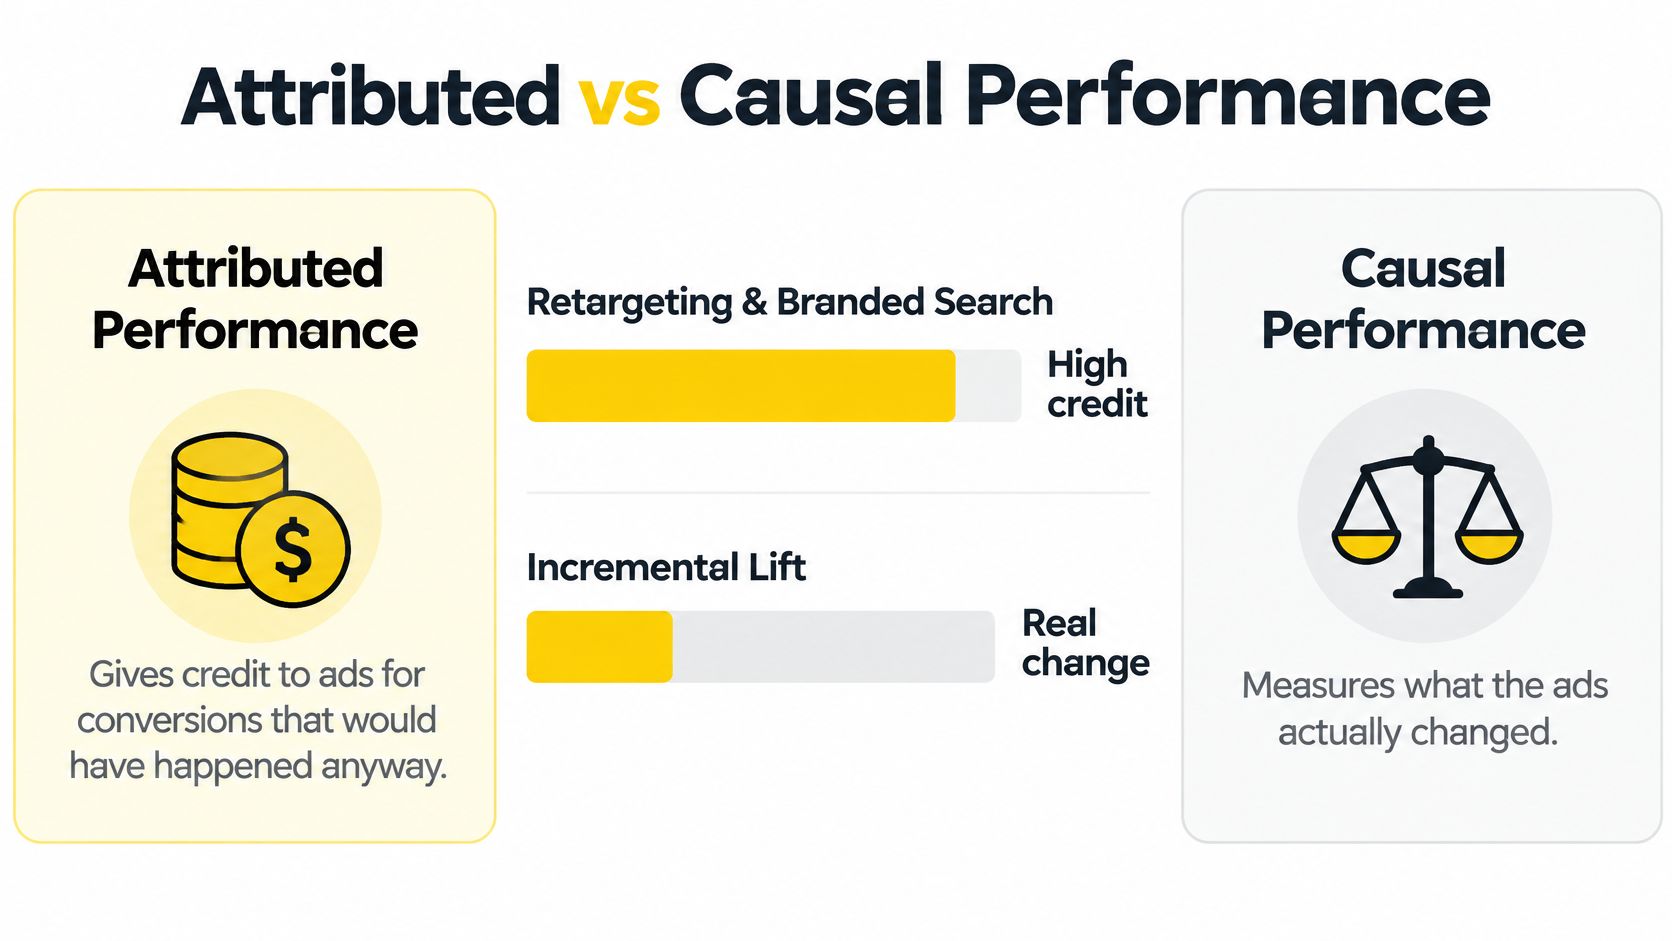
Put five things beside platform ROAS: incremental ROAS, test confidence, holdout size, test dates and the share of spend covered by experiments. Without them, credited revenue reads as proof and the budget conversation ends early. When attributed ROAS is strong but incremental lift is weak, reduce that channel and watch the total for a full cycle before deciding again. A holdout is an experiment, and it earns the same discipline as any other split test, which is what A/B experiment best practices sets out.
Reconciliation Is the Step Most Dashboards Skip
Attribution tells you where credit landed. Reconciliation tells you whether the business outcome arrived. The gap is wide: the 2025 State of Marketing Attribution Report found that only 6 in 10 B2B marketers track pipeline generated, only half can measure opportunities created, and just 1 in 3 report new ARR.
For a real-estate team, revenue lands months after the click, so this month's dashboard is incomplete by design. For a tax planner, webinar registrants convert after the season ends. For a home services business, a lead that never answers the phone still inflates the count. Each case needs the same six signals, not one blended cost per acquisition.
Signals that separate real impact from reported credit
Signal | What it tells you | Dashboard action |
|---|---|---|
Platform-reported ROAS | Revenue the ad platform claims it caused | Show beside incremental ROAS, never alone |
Incremental ROAS | Revenue that would not have happened without the ads | Drives budget shifts after a holdout test |
Event-match rate | Share of platform conversions matched to site or CRM records | Below target means fix tracking before ranking campaigns |
Lead-status aging | How long leads sit unqualified or unbooked | Flags stale leads that distort cost per qualified lead |
Revenue latency | Days between click and recorded revenue | Sets the lookback window and reconciliation date |
Confidence band | Range of likely error around a metric | Stops small-sample ratios from looking precise |
A dashboard that looks complete while omitting these outcomes is more dangerous than a rough one that admits its gaps.
A Week of Dashboard Decisions in Practice
Say a direct-to-consumer brand sells ceramic drinkware and spends $20,000 a month across Meta, Google and TikTok. Every figure in this example is invented to show the sequence, not borrowed from a real account.

Monday, Two Numbers That Seem to Settle It
The weekly report lands and Meta shows a 4.2 ROAS while Google branded search shows 6.1. The team's instinct is to move money out of Meta and into branded search before lunch. That's a reasonable read of the two platform reports, and it's wrong.
The same dashboard, set to data-driven attribution, shows branded search's credited share of revenue falling from about 60% to about 35% once the earlier TikTok and Meta touches are counted. Nothing about the campaign changed. The credit did.
Wednesday, One Test Changes the Plan
A holdout test on branded search returns weak incremental revenue. A non-brand prospecting campaign, meanwhile, adds more revenue than its credited share suggests, because it starts paths that branded search finishes. The decision follows in one sentence: move $3,000 a month from branded search into non-brand prospecting and keep the test running for three weeks.
The same pattern plays out in lead generation. A med spa shortens its booking form and cost per lead drops by 20%, which looks like a win until the dashboard reconciles form fills with booked appointments and cost per qualified lead rises. The decision: keep the new form only if qualified-lead volume stays sufficient for the month.
For a walkthrough of how these pieces connect in one reporting flow, the video below is worth the few minutes.
Every decision in that week came from combining credit, lift and reconciliation. No single number on any screen would have produced the same call.
Channels That Belong on One Dashboard
Any channel with a real cost earns a row: Meta for Facebook and Instagram, Google Search, YouTube, TikTok, email, organic search, plus print, radio or direct mail wherever you spend money. The screen exists for comparison, and comparison only works when the rows are built the same way.
Same Fields, Same Dates, Same Currency
For each channel, store spend, impressions or sends, clicks or sessions, attributed conversions, attributed revenue, and the cost ratio already defined for that outcome. Same date range, same currency, same model. A channel that can't fill those fields still gets a row. It just gets marked as unreconciled so nobody mistakes it for invisible.
The digital-only habit is common and it costs money. 70% of global marketers planned to increase performance marketing spending at the expense of brand-building budgets in 2024, according to Nielsen's 2024 Annual Marketing Report. In the same period, 84% were extremely or very confident in their marketing technology's ROI measurement, while only 38% measured traditional and digital marketing together, per Nielsen's 2024 survey release.
Confidence and coverage aren't the same thing. A 2024 survey by Wakefield Research, sponsored by LiveRamp, found that 86% of executives could not accurately measure their campaigns' influence on conversions, as reported in Adweek's summary of the LiveRamp findings.
Why the Offline Row Stays on the Screen
Run one check by hand each month. A branded search campaign with a strong ROAS sits next to a radio test that has no pixel attached; enter the radio spend for the same week and any assisted conversions you can trace, then read the two rows together. If you can't trace any, label the row unreconciled and keep it visible anyway.
Move budget only between channels that share one attribution model, one sample-size label and a reconciled outcome.
The four parts we work on with clients at Wojo Media, the offer, the landing pages, the omnipresent ads and the backend KPIs, all succeed or fail on this screen. A channel you can't reconcile is a channel you can't scale.
Wojo Media builds the measurement layer that makes these decisions possible: offers and guarantees, conversion-focused landing pages, omnipresent ads across Facebook, Instagram, TikTok, Google and YouTube, and backend KPI tracking reconciled to real revenue. A free demo call with Jason or a growth manager is the first step to a custom paid ad strategy built around your funnel. Visit Wojo Media and we'll walk your dashboard one layer at a time.
Comments