
How Paid Ads Management Works: From Plan to Scale

You're paying Meta and Google every month. The dashboards show clicks, the website gets visitors, and inquiries arrive, but sales aren't following. When someone asks what the ads produced, you can't confidently connect the spend to money in the bank.
That's the problem paid ads management should solve. It isn't just buying traffic. It's managing the whole path from an advertising promise to a qualified customer, then deciding whether the next investment makes business sense.
The Five Stages Every Paid Ads Manager Runs
Say a business spends a hypothetical $3,000 a month on Meta and Google, gets plenty of clicks, but records no sales. The owner suspects the targeting. A campaign manager starts with a broader question: where does the journey break?
Paid ads management is the ongoing work of planning, producing, tracking, and improving paid campaigns across platforms such as Google, Meta, TikTok, and YouTube. The objective is profitable customer acquisition, not more activity inside an advertising account.
Think of a restaurant manager. They don't cook every dish, but they coordinate the menu, who walks in, kitchen costs, and whether the restaurant makes money. An ads manager coordinates the offer, audience, creative, website experience, and commercial results.
The work follows a loop
The scale of the job has changed: U.S. internet advertising revenue reached $225.0 billion in 2023, according to the IAB/PwC revenue report. It reached $294.6 billion in 2025, up 13.9% year over year, according to IAB and PwC, making disciplined channel selection and measurement increasingly important.
The five stages of paid ads management
Stage | What the manager does | Metric to watch |
|---|---|---|
Plan | Set goals, budget and channel mix | Target cost per acquisition |
Create | Build offers, creative and landing pages | Click-through rate and landing-page conversion rate |
Track | Connect ad clicks to leads, sales and revenue | Tracked conversions compared with CRM outcomes |
Optimize | Adjust bids, budgets, audiences and creative | Return on ad spend and cost per qualified lead |
Scale | Raise spend only where profit holds | Return on the extra spend added |
The operational flow also includes launching campaigns and reporting what happened:
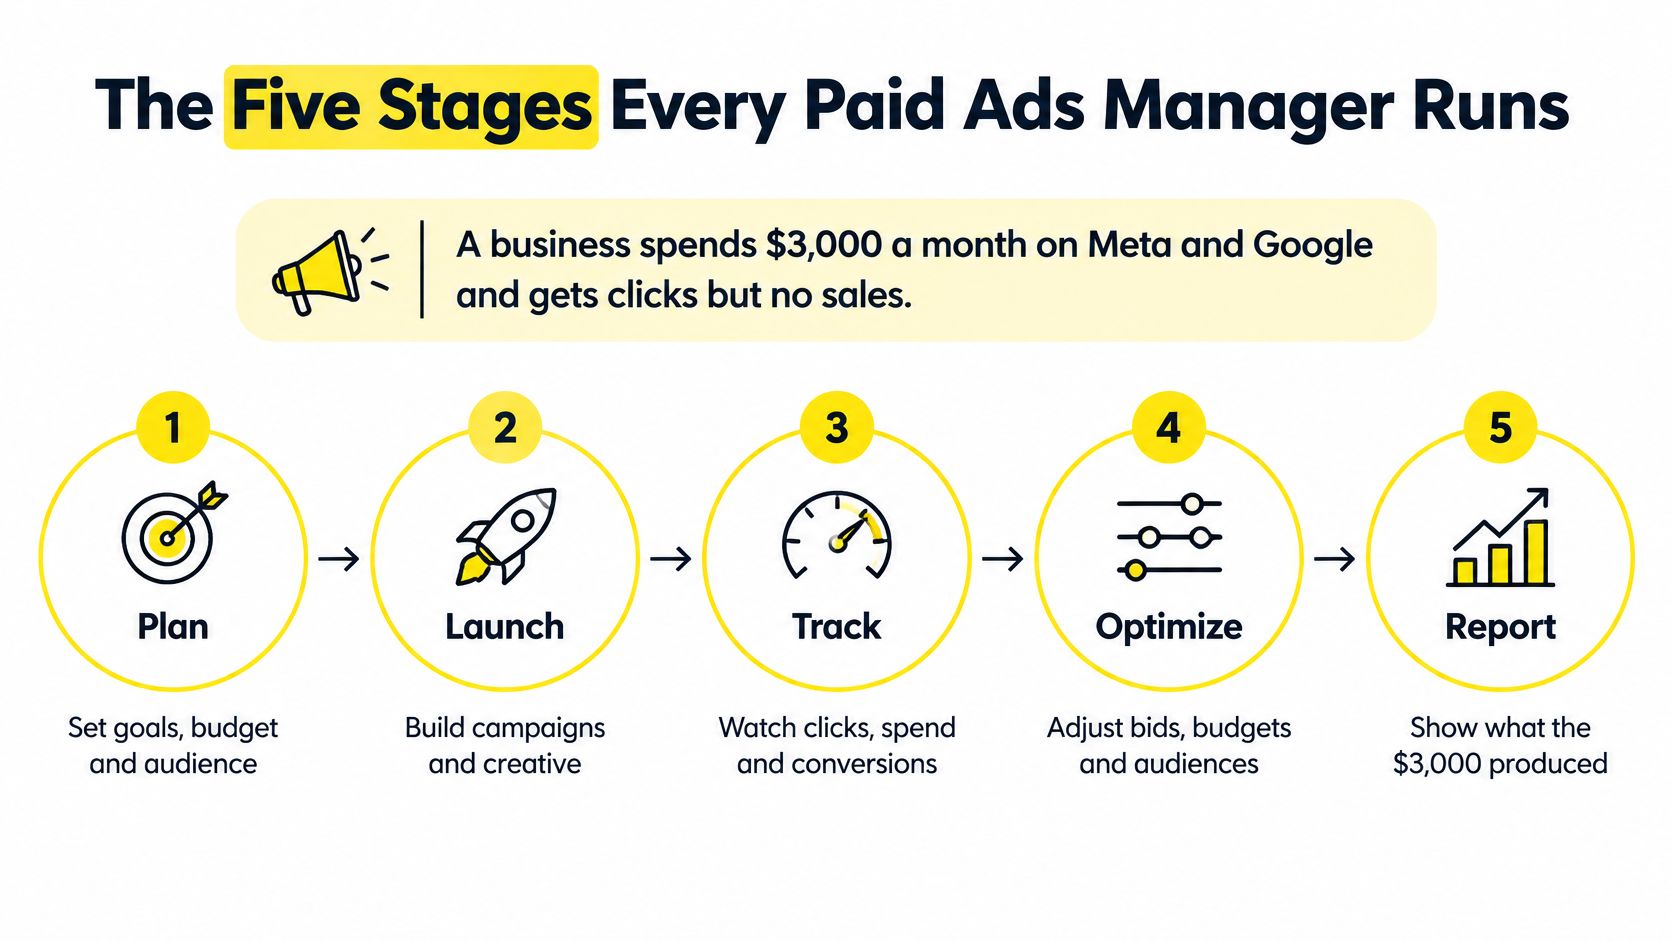
These aren't boxes you check once. Sales results change the plan, customer objections inform creative, and reporting determines whether you scale.
When campaigns underperform, audit tracking first. Otherwise, you might change a working campaign because its results aren't being recorded.
Set Goals, Budget and Channel Mix Before the First Ad
Choose a primary outcome: purchases, qualified inquiries, or booked calls. A campaign built to generate website visits shouldn't be judged as though it was configured to acquire customers.
Then work backward from what a customer is worth. Cost per acquisition, or CPA, means advertising spend divided by acquired customers. Your target should leave room for fulfillment costs, overhead, and profit.
Calculate what you can afford
Consider a hypothetical product with a $200 average order value and a 40% gross margin. It produces $80 in gross profit before advertising. Spending that entire amount to acquire the sale would leave nothing for overhead or profit, so treat it as a ceiling before those costs, not a sensible operating target.
For budget planning, suppose an advertiser chooses an $80 target CPA and wants 10 acquisitions a week. The arithmetic implies $800 in weekly media spend, assuming the target is achievable. This is a planning scenario, not a promise that spending the budget will produce those customers.
If your affordable budget can't support enough outcomes to evaluate several campaigns, start with fewer campaigns. Splitting limited spend across every platform makes diagnosis harder.
Choose channels by customer intent
Search represented 39.8% and social 34.3% of 2024 U.S. digital advertising revenue in the IAB's full-year revenue report; the table uses that report's revenue figures, with video and retail-media shares calculated against its $258.6 billion total.
Channel roles and 2024 U.S. revenue
Channel | Role in the plan | 2024 U.S. revenue | Share of digital ad revenue |
|---|---|---|---|
Search | Captures existing intent | $102.9 billion | 39.8% |
Social | Creates and qualifies demand | $88.8 billion | 34.3% |
Digital video | Builds attention with video-led formats | $62.1 billion | Approximately 24.0%, calculated |
Retail media | Connects ads with purchase data | $53.7 billion | Approximately 20.8%, calculated |
These categories overlap, so don't add their shares together or use them as a recommended budget split.
A plumber serving urgent searches might prioritize search. A coach explaining an unfamiliar service may need social creative before prospects know what to search for. Retail media is more relevant when products and retailer purchase data are central to the buying journey.
For longer sales cycles, H2's resource on measuring demand generation performance offers useful context for separating early interest from sales-ready demand.
Before launch, write down your target CPA, affordable weekly campaign budget, and starting channel allocation. Those decisions give the manager boundaries rather than a vague instruction to get results.
Creative and Landing Pages That Earn the Click
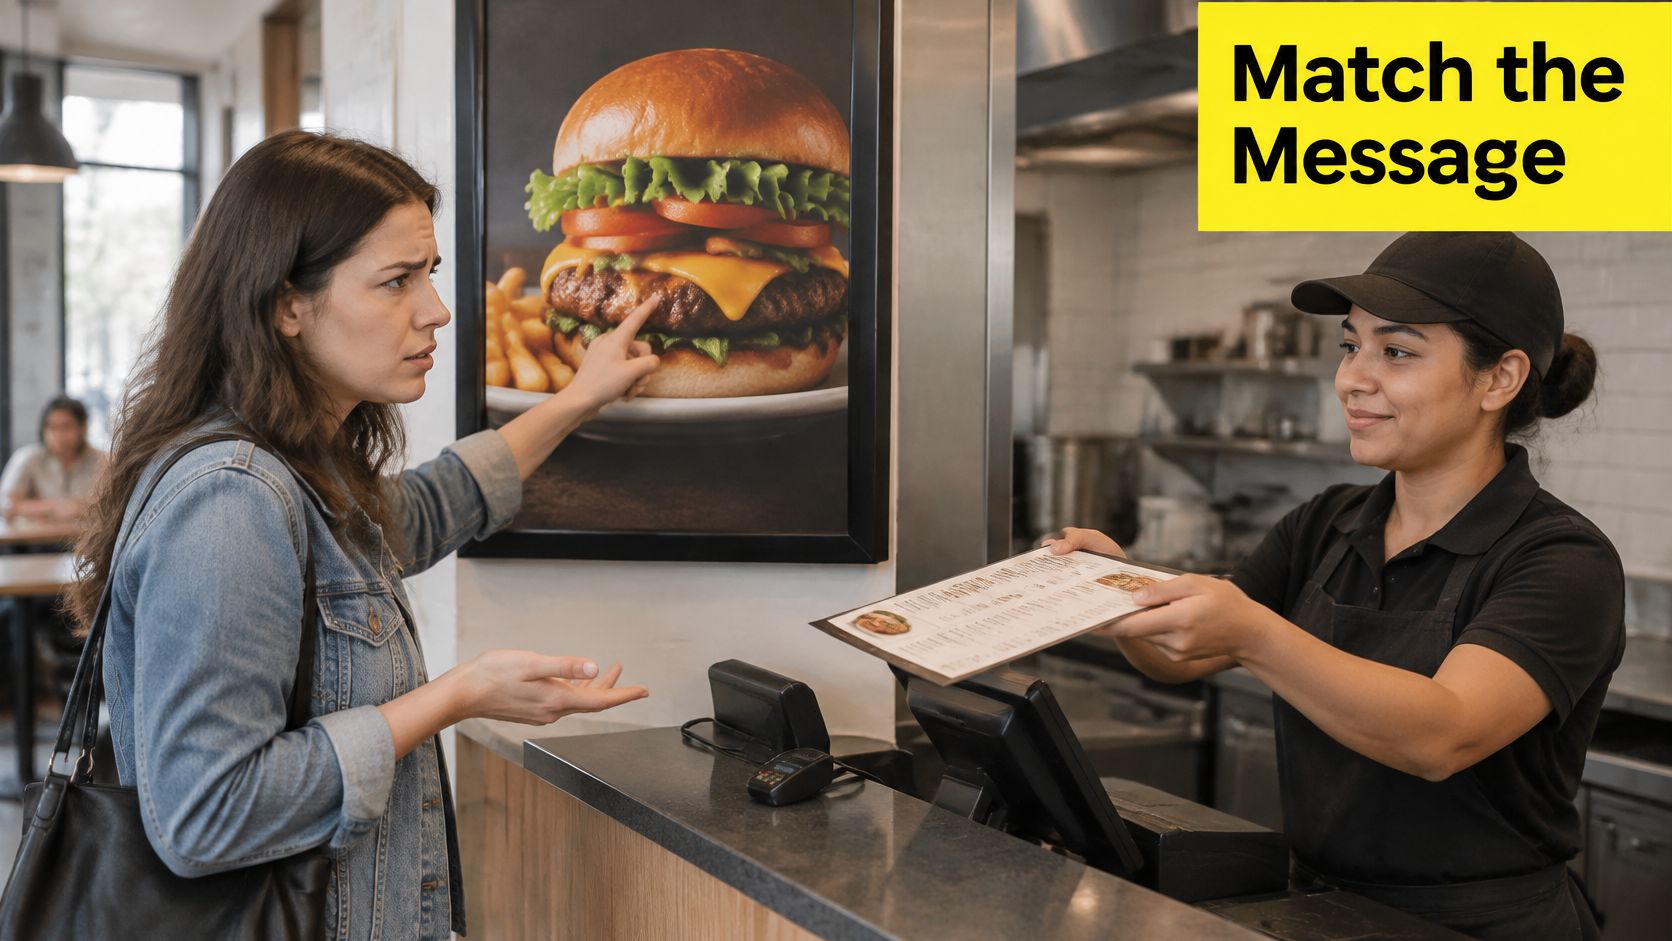
A prospect clicks an ad promising a specific service and lands on a generic homepage. That's like asking a restaurant for a particular dish and receiving the entire menu. The business has made the customer start the search again.
Message match means the ad headline, offer, and landing-page headline describe the same outcome. If your ad promotes a tax-planning webinar, the destination should explain that webinar, who it's for, and how to register, not introduce every advisory service you offer.
The customer's frustration is easy to recognize:
Test the promise before decorating it
Creative can include static images, short videos, story ads, and user-generated content. Choose formats that can demonstrate the offer clearly rather than producing video because it's fashionable.
U.S. digital-video advertising revenue grew 18% in 2024 to $64 billion, according to the IAB's video ad spend report, which projected $72 billion for 2025. That's a reason to test video, not evidence that it will outperform a static image in your account.
Start with a focused test matrix. The quantities below describe a proposed experiment, not an industry benchmark.
Test matrix for hooks, formats and landing pages
Variable | Variants to test | Decision rule |
|---|---|---|
Hook in the first three seconds | Problem, proof, offer | Keep the highest-converting hook after the planned conversion target; replace consistent laggards |
Format | Static image, short video | Favor the lower cost per qualified lead once results are sufficiently mature |
Landing page | One page, one offer, one call to action | Keep while conversion performance holds; investigate headline alignment if it weakens |
Test the hooks within the same format before comparing formats. Otherwise, you won't know whether the opening message or the production style caused the difference.
Remove reasons to hesitate
Make the page fast and usable on mobile. Put relevant reviews, clear terms, and evidence near the decision point, and collect only information needed to qualify or fulfill the inquiry.
For online stores, Shugert's CRO guide for established DTC brands provides a useful companion to ad testing because product-page and checkout friction can undermine otherwise relevant traffic.
Testing rule: Agree on the outcome, spending limit, and evaluation window before launching. Don't declare a winner because an ad collected clicks quickly.
A higher click-through rate is useful only when the people clicking can become worthwhile customers.
Tracking Conversions When Platforms Disagree
A 2025 survey of 750 large-company employees across the United States, United Kingdom, Europe, Middle East, Africa, Asia-Pacific, and Australia found that 18% were very confident they could attribute app installs to the correct source, while 74% said privacy regulations created costly measurement blind spots, as reported by MediaPost. The app-install finding isn't a benchmark for every advertiser, but it illustrates why attribution deserves scrutiny.
Advertising platforms don't necessarily count the same events in the same way. Someone might watch a social ad, search for the business later, and buy after clicking a search ad. Different attribution windows and credit rules can let both platforms claim influence over that purchase.
Think of attribution as several witnesses describing a journey. Each has a partial view. Adding every account together doesn't produce a reliable total.
Build a weekly reconciliation routine
Use the customer relationship management system, or CRM, to connect inquiries with what happened afterward.
Standardize campaign tags. Use consistent UTM parameters for source, medium, campaign, and creative. Preserve those values in forms and customer records where your setup and consent choices support it.
Compare records, not just totals. Match platform-reported leads with CRM inquiries, qualified opportunities, and closed sales. Investigate missing records and differences in event definitions.
Return downstream outcomes. Import supported offline events, such as qualified leads, attended appointments, or purchases. Apply refunds and cancellations in the reporting layer, and use platform adjustments where supported.
Deduplicate business outcomes. Use stable order or lead identifiers so a purchase remains a single business transaction even when several platforms claim credit.
Test incrementality. Where volume and campaign design permit, use a randomized holdout that doesn't receive the ads. Compare outcomes to assess whether advertising caused additional sales.
Follow applicable consent requirements and platform policies when collecting or uploading customer information. Server-side tracking isn't permission to bypass a customer's choices.
Cheap leads can hide expensive customers
Say a campaign attracts people who happily submit forms but rarely attend appointments. Another produces fewer inquiries, yet those prospects fit the service and complete purchases. Optimizing solely for reported lead cost could direct money toward the less profitable campaign.
A platform conversion is an event. A qualified customer is a business outcome.
Use CRM-based contribution margin when reliable, mature sales records contradict platform ROAS. Contribution margin should account for net revenue and relevant variable costs, then advertising spend when assessing campaign contribution.
Don't override a dashboard merely because another report looks better. First check matching coverage, sales-cycle delays, and comparable customer cohorts. Neither platform attribution nor CRM attribution proves causation on its own.
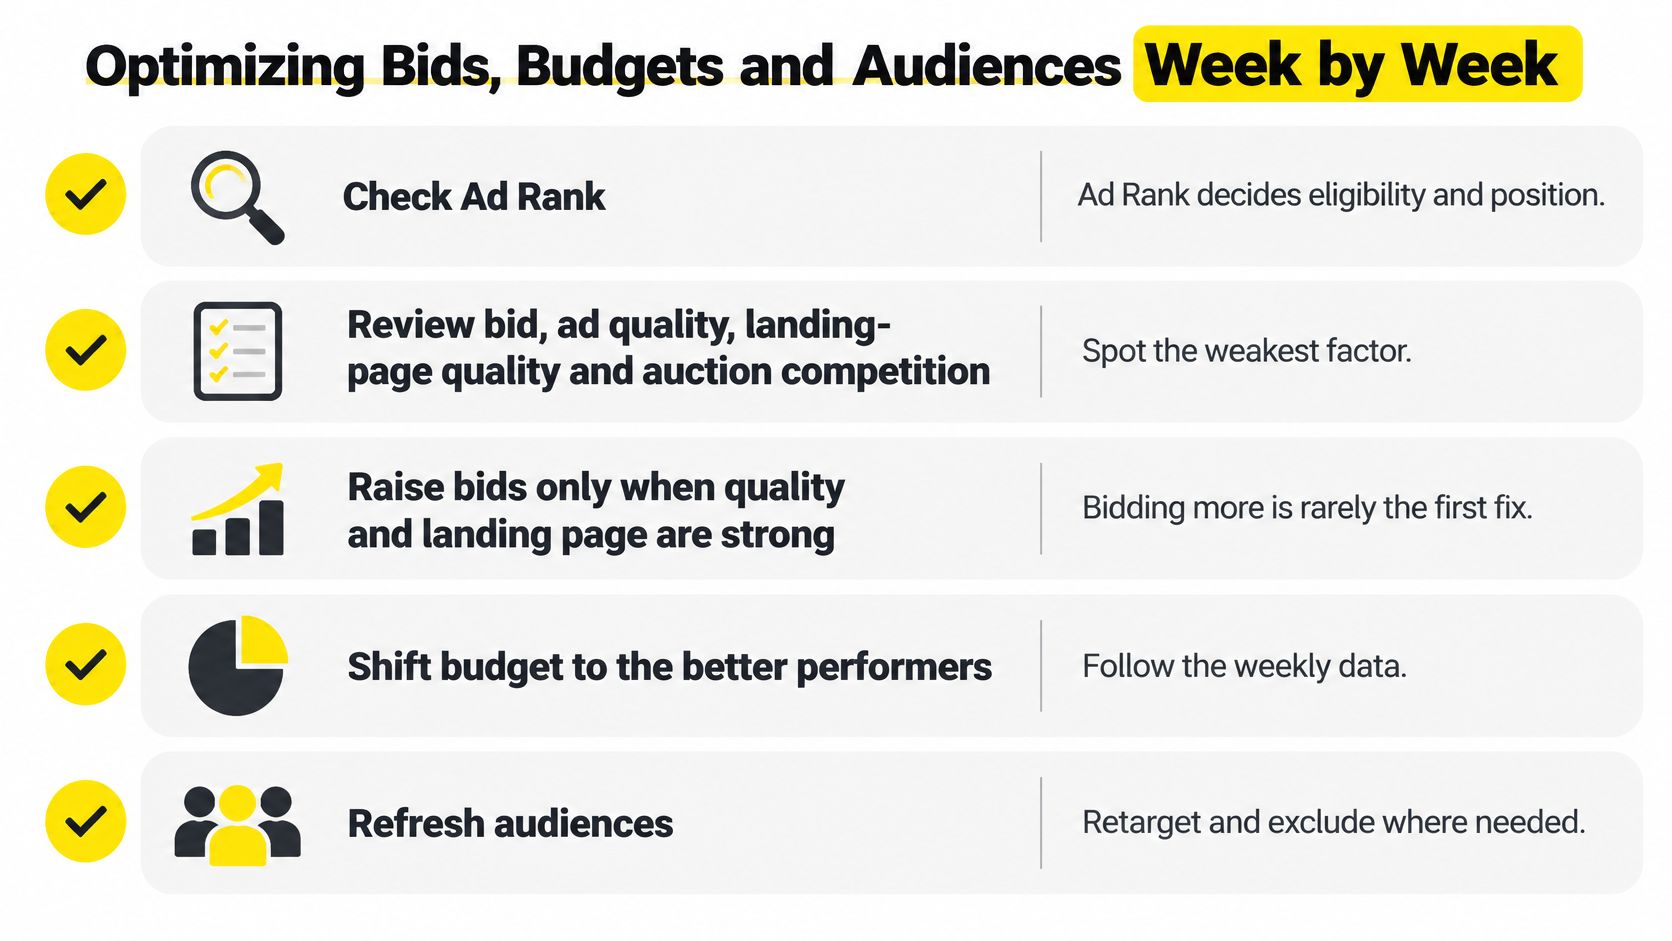
Optimizing Bids, Budgets and Audiences Week by Week
Fix relevance before paying more for exposure. Raising a bid can buy access to an auction without solving why the visitor doesn't want the offer.
Google's Ad Rank guidance explains that eligibility and position depend on factors including the bid, ad and landing-page quality, thresholds, competition, search context, and the expected impact of assets. Its Quality Score is a diagnostic estimate on a 1 to 10 scale, based on expected click-through rate, ad relevance, and landing-page experience, not a direct auction input.
That distinction matters. A manager should investigate the weak component rather than chase the score as a business objective.
Use this checklist to organize the review:
Diagnose before making changes
An account is like a kitchen during service. If orders stop reaching the cooks, buying more ingredients won't fix the problem. Identify the broken handoff before changing the inputs.
Symptoms, causes and first fixes
Symptom | Likely cause | First fix |
|---|---|---|
Cost per acquisition rises after a budget increase | Audience saturation or auction pressure | Hold the budget steady and inspect audience and auction changes before testing expansion |
Clicks are cheap but leads do not qualify | Ad promise or offer attracts the wrong prospects | Check message alignment, then clarify eligibility and the offer |
Spend is high and conversions drop to zero | Tracking broken or conversion event not firing | Verify conversion events before changing bids |
Weak quality signals in Google Ads | Low expected click-through rate or weak landing page | Tighten ad-to-keyword alignment and improve page usefulness |
Treat these as hypotheses, not diagnoses delivered by a spreadsheet. Poor lead quality can also come from incorrect geography, misleading incentives, or an overly broad offer.
For search, inspect actual search terms rather than only the keywords you selected. Add negative keywords for irrelevant intent, and separate materially different services when they need different messages or destinations.
Run a controlled weekly review
Review meaningful segments. Compare query intent, audience, device, geography, and new versus returning customers where the reporting supports it.
Stop demonstrated waste. Pause low-value ad sets only after checking sales delays and whether they support another part of the journey.
Adjust budgets deliberately. Make modest changes that suit campaign volume and bidding strategy. Avoid treating a universal percentage as a safe rule for every account.
Isolate the change. Don't replace the audience, offer, and bidding strategy together if you need to understand the result.
Keep a change log. Record the date, reason, expected effect, and review condition for each meaningful adjustment.
Choose review windows that allow delayed conversions to appear. A calendar reminder is useful, but it doesn't make incomplete results conclusive.
Use the accompanying video as an additional learning resource:
Finish each review with a clear decision: repair relevance and measurement, adjust bidding where justified, then reallocate budget. Making fewer explainable changes is more useful than constantly editing an account.
Scaling Spend Without Scaling Waste
Increasing spend amplifies whatever the account already buys. If a campaign attracts genuine prospects, more budget may help. If it attracts irrelevant visitors or automated submissions, a larger budget can purchase more waste.
Pixalate's Q2 2025 analysis of more than 120 billion global programmatic impressions measured invalid-traffic rates of 19% on web traffic, 29% on mobile-app traffic, and 18% on connected TV, according to its ad-fraud benchmark report.
Those programmatic findings aren't platform-specific fraud estimates for your search or paid-social account. They establish a reason to inspect inventory quality rather than assume every reported impression represents a relevant human prospect.
Evaluate the placements behind the volume
Before expanding a campaign, compare placements using engagement, valid contact details, qualification, appointment attendance, and sales. Look for clusters of irrelevant inquiries, suspiciously repetitive submissions, or traffic outside the intended service area.
Use available placement exclusions and brand-safety settings. For open-web programmatic buying, also review seller authorization and supply-path controls with the buying partner. Don't apply every programmatic safeguard indiscriminately to platform-native search and social campaigns.
Scaling guardrail: Increase spend where the additional customers remain commercially worthwhile, not merely where the dashboard records the most conversions.
A worked example of reported versus qualified cost
Consider this hypothetical account:
Reported performance: A business spends $5,000 across Meta and Google and receives 62 leads, approximately $81 per lead.
Qualified performance: Only 30 leads qualify, approximately 48% of the total. Cost per qualified lead is therefore about $167.
Management decision: The manager reallocates a hypothetical $1,000 from the weakest campaign to the campaign whose leads close most reliably, and excludes two placements producing junk inquiries.
These figures are illustrative arithmetic, not a client result or expected benchmark.
The manager then evaluates a mature batch of leads after enough time has passed for sales follow-up. The test succeeds only if the reallocated spend produces better qualified opportunities or contribution, not a prettier lead-cost report.
Keep capacity in view, too. A local service business can waste good inquiries if nobody answers calls, and an online store can lose the benefit of demand if stock or fulfillment fails.
Scale on marginal performance, meaning the return from the extra spend added. An account can show an acceptable historical average while its newest spending produces customers at an unsustainable cost.
Decide Whether to Run Paid Ads In-House or Hire Help
The decision depends on your budget, available management time, and access to clean sales records. Account complexity matters as much as spend. A focused campaign with a straightforward purchase path is easier to manage than a multi-platform funnel involving webinars, appointments, and delayed sales.
Running ads in-house can make sense when you can maintain a regular review routine, produce fresh creative, and troubleshoot measurement. Hiring help becomes more useful when the owner can approve decisions but can't consistently perform the specialist work.
Compare responsibility, not just fees
A flat retainer pays for an agreed scope. A percentage-of-spend fee increases as media spend rises, while a performance fee depends on how the contract defines results. None automatically guarantees aligned incentives.
When you compare pay per click services, examine who owns the accounts, what work is included, and whether reporting distinguishes qualified opportunities from raw inquiries. Define revenue attribution, cancellations, and lead acceptance before agreeing to performance-based compensation.
At Wojo Media, our four key parts are the offer, landing pages, omnipresent ads, and backend KPIs. We optimize the offer and guarantee, then build the landing page and ad copy to match.
Prepare the business inputs
Bring the information a manager needs to make commercial decisions:
Offer economics: Current pricing, margins, guarantees, and fulfillment limits.
Campaign history: Past creative, spend reports, and known tracking problems.
Sales definitions: CRM stages and clear qualification criteria.
Budget boundaries: What you can invest while testing without assuming immediate payback.
You don't need to hire anyone to take a useful step this week. Follow a test inquiry from the ad destination through the form, CRM, and sales reporting. Document any missing handoff before committing more budget.
Wojo Media connects offer development, matching landing pages and ad copy, multi-platform advertising, and backend performance measurement. Visit Wojo Media to book a free demo call with Jason or a growth manager, the first step toward a custom paid ad strategy built around your business outcomes.
Comments